Full dissertation
Complete text of the Master's dissertation, defended at the PUCRS Graduate Program in Orthodontics and Dentofacial Orthopedics in December 2001.
PONTIFICAL CATHOLIC UNIVERSITY OF RIO GRANDE DO SUL
SCHOOL OF DENTISTRY
GRADUATE PROGRAM IN ORTHODONTICS AND DENTOFACIAL ORTHOPEDICS
STUDY OF THE INFLUENCE OF FEMALE FACIAL PROFILE ANGLES ON THE PREFERENCE OF ON-LINE EVALUATORS
RODRIGO MARTINS BOOS
Dissertation presented as part of the mandatory requirements for obtaining the degree of Master of Science in Orthodontics and Dentofacial Orthopedics (evaluated and approved by the Scientific and Ethics Committee of the School of Dentistry of PUCRS – protocol no. 30/00).
Prof. Ernani Menezes Marchioro, DDS, PhD Advisor
Porto Alegre (RS), Brazil, December 2001.
DEDICATION
To my family and to Ana Carolina, in recognition of their attention, understanding, and constant encouragement.
ACKNOWLEDGMENTS
To God, for everything.
To the Pontifical Catholic University of Rio Grande do Sul, for the opportunities offered.
To the School of Dentistry of the Pontifical Catholic University of Rio Grande do Sul, for its welcoming and scientifically stimulating environment.
To Prof. Marília Gerhardt de Oliveira, DDS, PhD, Coordinator of the Course in Oral and Maxillofacial Surgery and Traumatology, for her exemplary academic conduct and her friendship.
To Prof. Ernani Menezes Marchioro, DDS, PhD, for his dedication and interest in creating a synergistic scientific research environment, free of personal interests.
To the Professors of the Master's Course in Orthodontics and Dentofacial Orthopedics of the Pontifical Catholic University of Rio Grande do Sul.
To the faculty and staff of the School of Dentistry of the Pontifical Catholic University of Rio Grande do Sul, for their productive companionship.
To my colleagues from the Master's Course in Orthodontics and Dentofacial Orthopedics of the School of Dentistry of the Pontifical Catholic University of Rio Grande do Sul — Alessandro Bellato, Breno Ramos Boeira Júnior, Daniela Franz Nobre, Hélcio Andrade, Lúcia Helena Malfussi Horst, Patrícia Leite Leal, Rodrigo Machado Delabary — for their companionship and unity.
To my office colleagues, Rui Henrique Boos, Cleusa Martins Boos, Letícia Martins Boos, Ana Carolina Klauck, Adriana Stein Vargas, Denise Coimbra, and Suzana Boos Höher, for their unquestionable help throughout the course.
To the Director, Vice-Director, professors, staff, and colleagues of PUCRS Virtual, for the environment of learning and friendship they provided.
To the Rio Grande do Sul Orthodontic Society, its board, and members, for their constant encouragement in the pursuit of knowledge and professional ethics.
To every evaluator who answered the questionnaires — without whom this work would not exist — who kindly, moved by concern for the common good, set aside their own affairs to contribute to the search for better health solutions for the Brazilian people.
To everyone who, in some way, helped in the preparation of this work.
IV
TABLE OF CONTENTS
LIST OF FIGURES ............................................................................................. VII LIST OF GRAPHS ............................................................................................. VIII LIST OF TABLES ............................................................................................... IX LIST OF ABBREVIATIONS, ACRONYMS, AND MEANINGS ........................... X RESUMO (Portuguese abstract) ....................................................................... XII ABSTRACT .......................................................................................................... XIV 1 INTRODUCTION ................................................................................................ 16 2 LITERATURE REVIEW ..................................................................................... 19 2.1 Studies on measurements of the human face .......................................... 19 2.2 Studies on human preference and perception .......................................... 31 2.3 Studies on samples obtained through digital media ................................. 44 3 METHODOLOGY .............................................................................................. 52 3.1 Material ....................................................................................................... 52 3.2 Method ........................................................................................................ 53 4 RESULTS ........................................................................................................... 75 4.1 Images with greatest preference ............................................................... 78 4.2 Images with least preference ..................................................................... 81 4.3 Frequency of votes by sex, male or female ............................................... 82 4.4 Frequency of votes by region ..................................................................... 84 4.5 Frequency of votes according to occupation ............................................. 86 4.6 Frequency of votes by ethnicity .................................................................. 88 4.7 Frequency of votes according to age group ............................................... 90 4.8 Results of the logistic regression analysis ................................................. 92 5 DISCUSSION ...................................................................................................... 97 5.1 Analysis of preference associated with the groups studied ...................... 97 5.2 Analysis of preference associated with the angles studied ...................... 101 5.3 Other considerations .................................................................................. 104 6 CONCLUSION .................................................................................................... 109 7 REFERENCES .................................................................................................... 111 ANNEX A – Approval by the Scientific Committee and Ethics Committee ANNEX B – Informed consent for use of the images APPENDIX 1 – Additional information on CD-ROM
Note: page numbers above refer to the original Portuguese dissertation and are retained here only as a structural reference; they do not correspond to page numbers in this document.
LIST OF FIGURES
Figure 1 – Initial image digitized from the photograph ....................................... 54 Figure 2 – Image with projection of the upper lip .............................................. 57 Figure 3 – Image with retrusion of the upper lip ................................................ 57 Figure 4 – Image with projection of the upper lip and the lower lip .................. 58 Figure 5 – Image with retrusion of the upper lip and the lower lip .................... 58 Figure 6 – Image with projection of the lower lip and chin ............................... 59 Figure 7 – Image with retrusion of the lower lip and chin ................................. 59 Figure 8 – Image with projection of the entire lower third of the face .............. 60 Figure 9 – Image with retrusion of the entire lower third of the face ................ 60 Figure 10 – Image with vertical increase of the lower third of the face ............ 61 Figure 11 – Image with vertical decrease of the lower third of the face ........... 61 Figure 12 – Angular measurements performed ................................................. 65 Figure 13 – Points used in the computerized analysis ...................................... 66 Figure 14 – Printout of the electronic questionnaire used ................................ 69
LIST OF GRAPHS
Graph 1 – Representation of vote frequency by image ..................................... 77 Graph 2 – Vote frequency for the most preferred images ................................ 78 Graph 3 – Variation of the Nasolabial angle according to image preference .... 79 Graph 4 – Variation of the Labial angle according to image preference ........... 79 Graph 5 – Variation of the Mentolabial angle according to image preference ... 80 Graph 6 – Variation of the Facial angle according to image preference ........... 80 Graph 7 – Vote frequency for the least preferred images .................................. 81 Graph 8 – Distribution of vote frequency according to sex ............................... 82 Graph 9 – Distribution of vote frequency according to region .......................... 84 Graph 10 – Distribution of vote frequency according to occupation ................ 86 Graph 11 – Distribution of vote frequency according to ethnicity ..................... 88 Graph 12 – Distribution of vote frequency according to age group .................. 90
LIST OF TABLES
Table 1 – General information on the data obtained ......................................... 75 Table 2 – Distribution of vote frequency by image ........................................... 76 Table 3 – Characteristics of the images with greatest preference .................... 78 Table 4 – Characteristics of the images with least preference ......................... 81 Table 5 – Distribution of vote frequency by sex ................................................ 83 Table 6 – Distribution of vote frequency by region ........................................... 85 Table 7 – Distribution of vote frequency by occupation ................................... 87 Table 8 – Distribution of vote frequency by ethnicity ........................................ 89 Table 9 – Distribution of vote frequency by age group ..................................... 91 Table 10 – Input data for the estimation of the regression model .................... 92 Table 11 – Description of the variables used in the logistic regression ........... 92 Table 12 – Results of the logistic regression ..................................................... 94 Table 13 – Levels of the explanatory variables with the highest choice frequency . 95
LIST OF ABBREVIATIONS, ACRONYMS, AND MEANINGS
| Abbreviation | Meaning |
|---|---|
| ' | referring to soft tissue |
| % | percentage |
| π | statistical probability of success |
| β | partial regression coefficient |
| ± | standard deviation |
| ® | registered trademark |
| 3D | three dimensions |
| averageness | tendency toward the mean |
| CMYK | color standard for printing |
| Cookie | remotely recorded line of code |
| DPI | dots per inch |
| electronic mail | |
| Exp(β) | odds ratio |
| g/m² | grams per square meter |
| Gb | gigabyte |
| HTML | Hyper Text Markup Language |
| i | image |
| IP | Internet protocol |
| JPEG | Joint Photographic Experts Group (compression algorithm) |
| Kbit/s | kilobits per second |
| LAN | local area network |
| LASER | light amplification by stimulated emission of radiation |
| m | meter |
| Mb | megabyte |
| MHz | megahertz |
| mm | millimeter |
| modem | modulator-demodulator |
| morphing | gradual visual transformation of an image |
| mouse | manual pointing and selecting device |
| º | degrees |
| on-line | connected to / using the Internet |
| p | probability that the same result would occur by chance |
| pixel | picture element, the smallest unit of a digital image |
| RAM | random access memory |
| RGB | color standard for monitors |
| scanner | optical digitizer |
| sig. | significance |
| smudge | retouching tool |
| virus | malicious line of code |
| Web | the (World Wide) Web / Internet |
| X | explanatory variable |
| χ | Chi |
| Y | condition of image selection |
ABSTRACT (Resumo)
[Portuguese-language abstract, provided here for completeness/reference]
This work was carried out with the objective of investigating the influence of certain cephalometric angles of the female facial profile on the preference of on-line evaluators, through a collection of opinions using the worldwide computer network — the Internet. In addition, it aimed to evaluate whether differences exist in the results found when the different groups of respondents are analyzed, distributed by occupation, age group, ethnic origin, sex, and region of the country. To this end, eleven profile images altered through digital resources and presenting different cephalometric values were evaluated by 2,041 volunteers. The results obtained were submitted to Chi-square and Logistic Regression tests. Intra-observer and inter-observer tests were performed, and the methodology was tested to avoid selection, fatigue, and inducement errors, among others known in studies of this nature. Different programming algorithms were used to control several variables. The results indicated that when changes were made to the angles studied, there was a difference (p<0.001) in the evaluators' preference. Through this experiment it can be concluded that the groups studied showed consistent criteria for evaluating the esthetics of the facial profiles presented in the eleven images. This study allowed the conclusion that there are differences of opinion among evaluators when the associations between the evaluator's esthetic preference and their sex are analyzed. A significant association was also found between the preferred images and the evaluator's region of the country, as well as their ethnicity and occupation. When the cephalometric values of the images chosen by the evaluators were compared to standard values associated with each measurement, the following conclusion became evident: the majority of evaluators, among the options offered, preferred the images that presented a Nasolabial angle of 112 degrees, a Mentolabial angle of 147 degrees, a Labial angle of 107 degrees, and a Facial angle of 12 degrees.
Keywords: Internet, orthodontics, facial profile, esthetic preference.
ABSTRACT
This study was conducted with the objective of investigating the influence of certain cephalometric angles of the female facial profile on the preference of on-line evaluators, thru an on-line survey using a worldwide computer network - the Internet. Further, to evaluate the existence of differences on the results, among different groups of participants, compared by occupation, age, ethnic group, gender and geographic region. Eleven digital photographs created by digital imaging techniques and presenting different cephalometric values were evaluated by 2041 volunteers. The results were statistically evaluated by Chi-Square tests and Logistic Regression. Intra-observer and inter-observer tests were conducted, and the methodology tested against bias, fatigue and several other errors described in the literature. Several algorithms were used for variable control and error reduction, beside real-time statistics. The results indicated that – for the sample surveyed – the alterations in cephalometric angles influenced (p<0.001) changes in preference of the evaluators. Each group presented consistent evaluation criteria for the selection of esthetic facial profiles. There were differences in opinion between the different groups, when the associations between the esthetic preference and sex of the evaluator were compared. Significant association was also found between the preferred images and geographic region of the evaluator, between preferred images and the evaluator ethnic background, and occupation. When the profilometric values of the preferred images were compared to standard values for each angle, the following conclusion became evident: the majority of the respondents, among the given options, preferred the images that had a Nasolabial angle of 112º, Mentolabial angle of 147º, Labial angle of 107º and a Facial angle of 12 degrees.
Keywords: Internet, orthodontics, facial profile, esthetic preference.
1 INTRODUCTION
Facial esthetics is one of the greatest concerns of patients who seek orthodontic treatment (MERRIFIELD, 1966). Likewise, orthodontists increasingly use different analyses of facial esthetics to plan orthodontic treatment, together with the analysis of the patient's occlusion (PECK and PECK, 1970).
Facial analyses mostly use norms and standards generated in various countries, from different populations, races, and methodologies. These studies were concerned, for the most part, with measuring the average cephalometric values presented by the population, not always valuing the perception and preference of the population investigated (MEJIA-MAIDL and EVANS, 2000).
Orthodontists sometimes place their own esthetic standards above the preference standards of the population (PECK and PECK, 1970). It is essential that the orthodontist study facial beauty, balance, harmony, and proportion as perceived by the eyes of the general public, and not their own eyes or those of other professionals.
Thus, recent research has been dedicated to observing public perception and preference, interested in the population's view of the esthetics of the human face (AUGER and TURLEY, 1999).
These considerations suggest the need for a study to evaluate which characteristics of the facial profile the population observes in order to qualify a given face. Thus, to allow the orthodontist to succeed in obtaining or maintaining harmony of the facial profile, it is essential to know which structures the population studied considers when evaluating a face in profile.
Since this study sought to investigate the opinion of the on-line population, the use of research tools with broad reach was necessary. There are currently six million people using the Internet in Brazil, and the estimate for the next three years is that sixteen million Brazilian users will be on-line. The use of the Internet for academic and research purposes is not new — to date, several researchers, such as HOUSTON and FIORE (1998) and SHEEHAN and HOY (1999), among others, have used questionnaires based on Web pages or electronic messages to study groups of users. A relatively new use for this technology is the survey of large populations on a national or international basis.
The general objective of this investigation was to study the influence of certain cephalometric angles of the female facial profile on the preference of on-line evaluators, through a collection of opinions using the worldwide computer network — the Internet.
The specific objectives of the present investigation are: (1) to determine the main angular measurements of the facial profile evaluated by the population studied in the selection of an esthetic female facial profile; (2) to evaluate whether differences exist in the results found when the groups of respondents are analyzed, distributed by profession, age group, ethnic origin, sex, and region of the country.
2 LITERATURE REVIEW
2.1 Studies on measurements of the human face
DA VINCI (1488) depicted in his studies a human face viewed in profile, with lines indicating proportions of the head. Despite the countless studies of facial proportion carried out throughout his life, the author considered his attempts to describe the face in numbers to be frustrated.
DÜRER (1528) studied the importance of mathematics in the theory of beauty and art. One of his works, entitled "De Symmetria Partium in Rectis Formis Humanorum Corporum Libri" and published after his death, presents images in which the author investigates the influence of the mathematical theory of proportion. Many of his works have the dimensions of the head built from mathematical proportions.
LAVATER (1789) published an essay in which he sought to relate aspects of facial appearance to the personality of its bearer.
WALKER (1840) sought to classify various aspects of female facial esthetics, stating that the mouth depicted in works of art by the Greeks presents a prominent upper lip and slight projection of the lower lip.
WOOLNOTH (1865) described the facial classifications used in his time, stating that, viewed in profile, there are three types of face: the straight face, the convex, and the concave. The straight face is considered the most beautiful, according to this author, who specifies that in this type of face, when a straight line is drawn from the top of the forehead to the base of the chin, that line touches no more than the tip of the nose and a small part of the lip. The author further compared this to the convex face, where the components of the face would be in front of that line. For the concave face, this same line is distant from the facial structures, with the exception of the nose. He also commented that convex faces, within this criterion, have the advantage of preserving a youthful appearance, while concave faces seem to acquire signs of maturity earlier.
KINGSLEY (1880) emphasized, in a work considered the most complete in the field of orthodontics up to that time — with more than 350 illustrations made by hand by the author himself — that the attractiveness of facial features depends on the harmonious relationships of the facial configuration, while nonetheless recognizing the infinite variety of human features.
CASE (1893), citing some principles that guide the development of facial contours in orthodontic practice, commented that orthodontic treatment must allow adjustments — over time — for different types of physiognomies.
ANGLE (1900), when proposing different treatments for malocclusions, referred to the face of the Apollo Belvedere (a classical Greek sculpture) as possessing an esthetic standard to be sought in these corrections.
CASE (1905), questioning Angle's statements, again affirmed that orthodontic treatment must allow adjustments — over time — for different types of physiognomies, further arguing that standards of beauty for the profile should not be founded on classical ideals, such as that of the Apollo Belvedere.
ANGLE (1907) admitted that there is a need to individualize the esthetic ideal of the face viewed in profile for each case. In this new publication, he adds that beauty, balance, and harmony are not limited to a single facial type.
LISCHER (1912), in his work on principles and methods in orthodontics, stated that each patient would probably have an esthetic ideal to be pursued and that the face of Apollo should not serve as a reference in this situation.
CARREA (1924) used barium salt and lead wires on the soft tissues of the face to obtain cephalometric radiographs with the aim of delineating the structures making up the facial profile.
BROADBENT (1931), seeking to standardize the position of the patient when obtaining cephalometric radiographs, used a device called a cephalostat to stabilize the patient's head, which would become essential to this day.
HELLMAN (1939) studied the anatomical characteristics of the face and presented means and standard deviations of some of these structures.
BAX (1946), in a work on female beauty, analyzed the earliest printed treatises on beauty and esthetics, dating from the 16th century, citing Firenzuola (1493–1545). Regarding the ideal profile, one of these treatises describes that when the mouth is closed, the lips should touch in such a way that the lower lip projects no more than the upper, nor the upper more than the lower, and that at the angle they meet forming an obtuse angle.
DOWNS (1956) evaluated and suggested standard values for certain bony and dental characteristics, based on a sample of 20 white adolescents with excellent occlusion, divided by sex, originating from two earlier publications. From this work come the interincisal angle and mandibular plane measurements. Downs also questioned the frequent assumption of the time that the Frankfort Horizontal Plane (FHP) would be parallel to the ground when the person was looking straight ahead. This was tested by comparing 100 photographs of children standing and looking at their own eyes in a mirror. According to Downs, the FHP can be drawn on a photograph from the upper margin of the external auditory meatus to Orbitale, easily palpable and markable on the skin. The result showed that the mean position of the FHP is an upward inclination of 1.3 degrees, with a standard deviation of 5 degrees. Suspecting that a person might occasionally assume different positions, 15 members of the sample were selected for three or more additional photographs. Downs further commented that occasional differences between the cephalometric and photographic facial type disappear once the inclination is corrected.
WILSON (1957) questioned in his work the concepts of facial esthetics used by the Greeks in their sculptures, considering them incorrect and stating that they exhibit retrusion of the lower third of the face.
MOORREES (1958) used grid-shaped lines — similar to those used by DÜRER in 1528 — with the aim of enriching facial analysis.
BURSTONE (1958) measured facial convexity through the angle between the points soft-tissue Glabella (GL') to Subnasale (Sn) and from Subnasale to soft-tissue Pogonion (Pg'). The author suggests studying the contour of the facial covering owing to the possible variation in its thickness, length, and postural tone. Another consideration by the author reveals that the profile view of the face makes malformations more evident, as well as the changes brought about by orthodontic therapy, compared to the frontal view. In his sample of 40 young white adults, the facial convexity angle was –11.3°. The upper lip is positioned 3.5 ±1.4 mm beyond the line connecting subnasale to soft-tissue pogonion. The lower lip is positioned 2.2 ±1.6 mm beyond that same line. In this work Burstone also defines the nasolabial angle and the mentocervical angle, which average, in his sample, 114° in men and 118° in women, and –114° in men and 106° in women, respectively [sic, as originally reported].
According to CARPENTER (1959), rules or norms of ideal body proportions and harmonious anatomical relationships could already be found in Greece in the fourth and fifth centuries BC.
SUBTELNY and ROCHESTER (1959) compared cephalometric measurements of the skeletal profile with the components of the soft-tissue profile, in a sample obtained from cephalometric tracings of 30 individuals. The authors concluded that, with growth, both the soft-tissue chin and the bony chin tend to assume a more anterior position relative to the base of the skull, especially in males. In addition to this conclusion, the authors detected in this study that the nose continues to grow even after the pubertal growth spurt.
According to FISCHER (1965), the Greek philosophers perceived that beauty obeyed certain laws of geometry, and that it necessarily possessed a harmony of proportions.
GOLDWYN (1966) agreed with WALKER (1840), stating that the mouth depicted by the Greeks presents a prominent upper lip and slight projection of the lower lip.
BEARDSLEY (1966), in his publication addressing esthetics from classical Greece to the present, stated that Plato and later Aristotle defined "aesthetics" as the study of beauty and the philosophy of Art. Plato stated that "the qualities of measure and proportion invariably... constitute beauty and excellence."
BURSTONE (1967) measured lip position relative to the Sn–Pg' line. He found no significant differences in lip protrusion between men and women.
RICKETTS (1968), referring to the influence of the lips on facial esthetics, suggested a line tangent to the chin and the tip of the nose. Called by the author the "E Plane," or "Esthetic Plane," this line serves to evaluate lip projection. In white adults, the lower lip should be between one and four millimeters behind this line. The upper lip rests slightly posterior to the lower lip.
LEGAN and BURSTONE (1980) described a soft-tissue cephalometric analysis — developed for patients requiring orthognathic intervention — with the aim of complementing a pre-existing dentoskeletal analysis. According to the authors, this analysis was reduced to its most relevant and significant aspects, to make it more practical. The authors suggest that, when used together with other diagnostic resources, this soft-tissue evaluation allows the clinician to achieve good facial esthetics in their patients.
FARKAS et al. (1984) carried out a study on the proportions of the upper lip, lower lip, chin, and lower third of the face in 89 young adults, 39 women and 50 men. A second sample was used containing 100 young adults, 50 men and 50 women. According to the authors' conclusions, the neoclassical norms for the proportions related to the lower third of the face were not confirmed in this study.
BISHARA, HESSION, and PETERSON (1985) carried out a study on lateral radiographs of 20 men and 15 women, taken between the ages of 5 and 25, with the purpose of describing the changes occurring in the soft tissues during growth and orthodontic treatment. The aspects evaluated were the Holdaway angle, the Merrifield angle, and the relationship of the lips to the Ricketts esthetic line. The authors concluded that the Holdaway angle and the Merrifield angle do not behave in the same way with advancing age.
FARKAS et al. (1985) tested the validity of various neoclassical formulas of facial proportions in a group of 153 young adults. Although the formulas found some equivalence — in frontal view — in the sample, few equivalence relationships were found in the profile view of the face. The differences were greatest in the norms of vertical proportionality of the thirds of the facial profile. The authors concluded that, although the neoclassical norms correspond to some faces, they do not represent the average facial proportions of the sample, and their interpretation and prescription as an ideal facial proportion should be better tested.
PARK and BURSTONE (1986) carried out a study to test the effectiveness of using a cephalometric norm to obtain "desirable and predictable" facial esthetics. Their sample comprised thirty randomly selected, orthodontically treated patients. A pilot sample of "excellent faces," known as the "Indiana Sample" — from the American state of Indiana — was used for comparison. Both soft-tissue and hard-tissue measurements were performed. They noticed that even cases that successfully achieved profiles similar to the norms showed great variability. The variability (two standard deviations) in lip protrusion relative to the Sn–Pg' line was 5 mm, or a total of 10 mm. Similar variations were found for other soft-tissue measurements. The results suggested that any dentoskeletal norm has questionable validity in achieving esthetics.
BASS (1991) presented a soft-tissue facial analysis that, according to the author, allows esthetic measurements and considerations of facial harmony without angular measurements. A visually determined horizontal esthetic line is used as a reference line.
PROFFIT (1991) described the analysis of the face in profile view, suggesting that to establish whether the jaws are proportionally positioned in the antero-posterior plane of space, with the patient in Natural Head Position (NHP), one could observe whether the face is approximately vertical, or whether it slopes anteriorly (anterior divergence) or posteriorly (posterior divergence) — terms coined by the anatomist MILO HELLMAN (1939). To evaluate lip protrusion, the author relates the lips to a true vertical line passing through the concavity at the base of the upper lip (soft-tissue point A) and through the similar concavity between the lower lip and chin (soft-tissue point B). According to Proffit, the lip should rest close to, or only slightly in front of, this line. If the lip is significantly in front of this line, the author notes, it can be judged as protrusive; if the lip is positioned behind the line, it is retrusive. This position should be examined with the patient's lips relaxed. The author also suggested evaluating vertical facial proportions and analyzing the mandibular plane angle.
LUNDSTRÖM et al. (1992) presented a proportional analysis for the soft-tissue facial profile, based on NHP, using a vertical reference line passing through Porion. This analysis evaluates 11 vertical and horizontal proportion indices of the facial soft tissues. They noticed that sexual dimorphism, with larger dimensions for men than for women, is more pronounced in the vertical plane. With the exception of lower facial height and mandibular prominence, the other measurements showed no statistical differences between the sexes.
FITZGERALD, NANDA, and CURRIER (1992), in a study evaluating the Nasolabial angle of 104 adults of both sexes, concluded that in their sample, the mean value for this angle was 114° ± 10°. The authors further report that no significant differences were found in this angle between the men and women evaluated.
McNAMARA Jr, BRUST, and RIOLO (1993) examined 136 Caucasian adults with ideal occlusion and balanced faces and found a combined mean, from the lower lip to the E Plane, for men and women, of –3.58 mm.
HOSS et al. (1997) used a database containing information on 42 Caucasian adolescent and pre-adolescent patients, with the aim of evaluating the technical accuracy and clinical acceptability of video imaging in predicting modifications to the facial soft tissues. Predictive profile images were created by computerized means and compared to the actual results of orthodontic treatment. The authors initially concluded that the facial predictions for pre-adolescents were performed with accuracy, with the exception of the lower lip region. In adolescents, however, the predictions were not acceptable. They concluded that such computerized prediction resources for orthodontic treatment outcomes would serve only as a marketing tool and not as a scientific method of prediction.
BISHARA, JAKOBSEN, HESSION et al. (1998), with the aim of describing the changes in the facial profile that occur with growth and with orthodontic treatment, used a sample of 20 men and 15 women. They analyzed cephalometric radiographs between the ages of 5 and 45. They concluded that the Holdaway angle for the soft tissues is a measurement influenced by age and decreases progressively from age 5 to 45. They also observed that the mean value for the lips of men and women was –3.37 mm in adults.
CHUNMANEECHOTE and FRIEDE (1999), with the aim of evaluating the degree of movement of the facial soft tissue relative to bony movement in mandibular repositioning surgeries, in addition to the analysis of lip and chin thickness, used profile lines in 41 Caucasian adults. From the results it was possible to suggest movement ratios and profile analysis lines that were then included in the facial profile change prediction program.
FERRARIO et al. (1999), using the coordinates of 22 soft-tissue cephalometric points from 1,157 children and adolescents and 191 adults, constructed lines representing each face. Superimpositions were performed between sexes and between adult and young faces of the same sex. In their conclusion, significant differences were highlighted in which the male sex presented a more prominent forehead, a larger and more vertical nose, and more prominent lips.
HSIEH et al. (1999) analyzed the facial profile characteristics obtained by prenatal sonography of 20 fetuses with Pierre Robin syndrome between 1990 and 1997. The data were cross-referenced with chromosomal characteristics and associated neonatal complications. Through this study it was possible to predict and provide prior counseling to the parents. The authors concluded that sonographic examination of the facial profile is necessary in cases of polyhydramnios, micrognathia, and cleft palate, frequently associated with Pierre Robin Syndrome.
FANIBUNDA and THOMAS (1999) produced anatomical superimpositions of soft-tissue facial profile images using digital imaging techniques associated with radiographic techniques, obtaining life-size images of the soft-tissue profile, skull, and teeth. They concluded that it is possible to eliminate problems of magnification, of different positions in radiographic exposures, and of overexposure of the facial profiles in radiographs.
CHEN and CHEN (1999), with the aim of planning and predicting postoperative changes in orthognathic surgery, carried out a study using 3D image acquisition of the face — from LASER scans — commenting on the advantage of using radiation-free resources for evaluation and decision-making regarding changes in the facial profile. They also comment that there is a growing need for better methods for surgical planning of profile changes. They concluded that the use of computerized resources to simulate surgeries and provide graphic information to patients is useful.
BORMAN, OZGUR, and GURZU (1999) directly measured the vertical and horizontal proportions of the face, as well as the inclinations of the soft tissues of the facial profile, in 1,050 young adults. Cephalometric values of populations from seven different geographic regions were analyzed. Some of the values were also compared with measurements from other populations cited in the literature, and the validity of neoclassical norms was tested. With the results, a convex profile proved frequent. The authors concluded that the neoclassical norms of facial beauty proved invalid for the population studied.
MEJIA-MAIDL and EVANS (2000), with the purpose of reviewing considerations related to the facial profile for orthodontic planning, cited some of the changes to which the facial profile can be subjected:
a) retract, maintain, or protract the upper lip, lower lip, or both; b) increase, maintain, or decrease the apparent vermilion of the lip (thickness); c) reduce lip tension, mentalis muscle tension, interlabial gap, or maintain lip competence; d) increase, maintain, or reduce the nasolabial angle; e) increase, maintain, or reduce the mentolabial angle; f) increase or maintain the mentocervical angle; g) increase, maintain, or decrease the vertical or antero-posterior dimensions of the chin.
The authors also commented that, of more than thirty-five cephalometric analyses published between 1937 and 1969, only one study reflected the opinion of the lay public regarding facial beauty — the work of RIEDEL, in 1957. Thus, they reflected average faces, the preference of the author who selected them, or even harmony, without characterizing the best or most beautiful face in the eyes of a given population. They also warned of the influences of culture, time, and geographic location on the concept of beauty. In this same publication, MEJIA-MAIDL and EVANS (2000) further describe some lines for facial evaluation:
Ricketts Esthetic Plane (RICKETTS, 1968) A line tangent to the chin and the tip of the nose. In white adults, the lower lip should be 4 ±3 mm behind this plane. The upper lip rests slightly posterior to the lower lip.
Gonzalez-Ulloa Vertical Line (GONZALEZ-ULLOA, 1962) Using a vertical line from the soft-tissue Glabella, the position of the chin is evaluated. The soft-tissue pogonion should be close to this line.
S Line (STEINER, 1953) According to Steiner, both lips would be slightly behind a line that extends from the center of the "S" curvature at the base of the nose and passes tangent to the chin.
Merrifield Z Line (MERRIFIELD, 1966) A line tangent to the chin and the most protruded lip (usually the upper). The lower lip should touch the line or fall slightly in front of it. In white adults, the line intercepts the horizontal at an angle of 80°±5°.
Holdaway Profile Line (HOLDAWAY, 1983) This line extends from the chin, passing through the upper lip, and goes approximately 10 mm beyond its apex. If the ANB angle is 2°, the profile line crosses the NB line at an angle of 8°. In this article the author presents an analysis of the facial soft tissues, questioning the analysis of the hard tissues alone for orthodontic treatment planning. The author states that these considerations were made based on his own personal impressions of the esthetic characteristics of the faces evaluated.
HWANG, KIM, and McNAMARA Jr (2000) selected 40 individuals with normal occlusion and no prior treatment, with the aim of determining which method for evaluating facial characteristics would be more reliable (tangent lines or anatomical points, for determining angles). They concluded that there were intra- and inter-observer statistical differences, with the anatomical-point method proving more faithful to the original profile. The main points of difference were found at the tip of the nose and the nasolabial angle. They suggest it is important that facial analyses describe which point-marking method was used.
SARVER and ACKERMAN (2000), in a review of trends in orthodontics regarding the evaluation of facial esthetics, suggested three basic requirements for the analysis of dentofacial esthetics in orthodontics:
a) dynamic and static evaluation of the face based primarily on clinical examination of the patient; b) determination of lip-tooth relationships and anterior dental exposure at rest and during facial movement; c) an analysis of the dental and skeletal facial volumes, as well as their effects on the covering facial soft tissue.
The authors suggested that, if possible, this process be interactive with the patient and that it would be greatly facilitated by the use of graphic images through computer simulations.
BETTS (2000) tabulated some ideal characteristics of a study intended to evaluate soft-tissue characteristics. He emphasized that the work should be prospective and have an adequate sample size. Randomization resources should be used in selecting the evaluators. The faces evaluated should be those of adult patients, without prior orthodontic treatment or esthetic surgeries. Cephalometric measurements and techniques should preferably be performed in a standardized manner, with the soft tissues at rest during the photographic or radiographic exposure. Additionally, the author recommended the use of a template to aid in locating points, the use of only one movement vector, and the presentation of operator-error analyses in the measurements and point identification.
2.2 Studies on human preference and perception
RIEDEL (1957) used in his sample 30 finalists from a beauty contest, selected by lay evaluators, justifying that up to that point studies had considered only the faces of patients with good occlusion and/or faces considered average or harmonious by orthodontists. The author concluded that the lay public presents a consistent and demonstrable concept of facial esthetic preference.
BARTLEY (1958) stated that our perception of shapes depends on the development of "shape concepts," and thus the frequent sight of a given facial pattern leads us to consider it "correct."
ILIFFE (1960) conducted a study on the population's preferences in female beauty. Published in a London newspaper, photographs of twelve women between the ages of 20 and 25 were rated for "beauty" or pleasing facial esthetics by 4,300 respondents. The responses were analyzed and tabulated by age, sex, and occupation of the voters. The positive correlations indicated that the public had a common basis for evaluating facial esthetics.
ADCOCK (1962) cited "selective conditioning," characterized by the public's tendency to unconsciously attribute youth to people wearing orthodontic appliances, or maturity to people wearing glasses, regardless of their actual age.
MARTIN (1964) examined the relationship between racial group and esthetic preference in female beauty among male evaluators. In this work, the author asked the evaluators to rank each face — from least characteristic of the Black race to most characteristic. In this way, it was determined which faces presented characteristics of Black ethnicity and which presented Caucasian characteristics. Three groups of men — fifty Caucasians, fifty American Blacks, and fifty African Blacks — then rated the photographs according to their attractiveness. The results indicated that white Americans and Black Americans share the same esthetic preference, for a face with Caucasian features, when judging beauty in female faces.
UDRY (1965), using the same twelve photographs used by ILIFFE (1960), carried out a parallel study in the United States, which obtained one hundred thousand responses from a newspaper advertisement. He concluded that there was significant agreement in the responses regarding the "most beautiful" face, and that the top three choices of respondents were the same as in the work carried out by ILIFFE (1960) in London.
FORD, PROTHRO, and CHILD (1966), as well as CHILD and IWAO (1968), carried out comparisons between esthetic evaluation criteria across different cultures. These authors used works of art rather than facial images as a source for evaluating facial esthetics. They concluded that the people interviewed used the same esthetic evaluation criteria regardless of nationality, age, sex, or occupation.
MOORE (1969) stated that there is no consensus in determining facial esthetics, and that what is esthetically pleasing to some is not pleasing to others.
PECK and PECK (1970), with the aim of studying the population's esthetic preference, used in their sample 52 young adults, 49 of whom were women and 3 men. The mean age of their sample was 21 years, 2 months. These 52 members of the sample were selected because their appearance had previously been acclaimed as possessing among the most pleasing facial esthetics, according to the authors. They observed that the cephalometric values of these sample members closely approximated the cephalometric norms previously established by Margolis, Downs, and Steiner. One trend observed was that the sample favored a protrusive dentofacial pattern, "fuller than the cephalometric norms would allow," they state. They warned that orthodontists sometimes place their own esthetic standards above the population's preference standards. They further state that it is essential that the orthodontist study facial beauty, balance, harmony, and proportion as perceived by the eyes of the general public, and not their own eyes or those of other professionals. In the study of the face, with the advent of psychology and sociology, the esthetic judgment of the face evolved from a simple sensation or impression into an exercise of visual perception.
Further on, the authors comment that the lay public's concept of facial esthetics is developed from external observations. A person can decide almost instantly whether a face seems pleasing to them or not, through an unstructured, subconscious decision. They cite that in prehistoric times, as can be confirmed by findings in the Lascaux caves — in southern France — prehistoric man already possessed the ability to reproduce, in his drawings, the anatomy of living beings. However, in the few representations of the human figure found from that period, it was recorded in a "vague" way, "probably to avoid any resemblance to existing people," out of superstition, according to VON KOENIGSWALD (1962) — probably for reasons of superstition and fear. Later, in ancient Egypt, the development of the culture of the Nile Valley allowed the recording of Egyptian ideals of beauty, where tendencies were found to show harmony and proportion, with vague resemblance to the people portrayed. It was also found that kings were portrayed with "ideal" proportions, while ordinary people were portrayed more realistically. PECK and PECK (1970) further cite that in the classical period it came to be considered that harmony was the property of that which "presents correct proportion." Since "aesthetics" goes beyond physical beauty, being also evaluated in the beauty of thought, of human emotion, and of existence, among others, they considered it acceptable to use the term "esthetics" for those matters susceptible to objective analysis. In this same work they describe the classical Greek human face, commenting that the basic facial characteristics of men and women were apparently identical, and that the lower third of the face appears well proportioned and within the orthodontic concept of an orthognathic profile. The lips frequently appear slightly parted, suggesting movement. Between the lower lip and the convex chin, a mentolabial groove or depression can be perceived. These notions of the ideal composition of the human facial form in classical Greek sculpture are important as a reference for the influence of harmony and proportionality on beauty, according to the authors.
According to COX and VAN DER LINDEN (1971), the use of measurements — of biological forms — for quantitative and qualitative analysis had its origin in ancient Egypt. These authors, in a study on facial harmony using silhouettes, stated that facial esthetics consists of a union of personal and social concepts, and is an important factor in orthodontic treatment planning. They used in their sample the opinions of 10 dental surgeons and 10 laypeople. The authors found no significant differences in this sample in the preference of dentists and laypeople for facial profiles.
FOSTER (1973) compared the opinions of groups of laypeople and professionals who evaluated silhouettes of male and female faces at ages 8, 12, 16, and at maturity. These silhouettes presented the lips in a more retrusive or protrusive position. The examiners were consistent in attributing a younger age to profiles with protruded lips. The results showed general agreement between the groups regarding the age and sex of the silhouettes. "Full" profiles were associated, by both groups, with female faces. Straight profiles were related to male faces and to older age groups. From these findings, the author concluded that lip position was related to age perception, with protruded lips appearing more youthful.
PRAHL-ANDERSON et al. (1979) evaluated differences in the esthetic preference of laypeople and orthodontists. Using facial profile lines that were subjectively evaluated by 1,150 parents, 72 dental surgeons, and 54 orthodontists, they concluded that significant differences existed in the evaluation by laypeople and professionals in 10 of the 11 profiles.
NANDA and GHOSH (1980) believe that the quality of facial esthetics can benefit from harmonious dental and skeletal relationships, but does not depend entirely on them. According to the authors, ideal concepts of beauty not only differ by race and sex, but also from one individual to another. The authors also state that people's appearance is the result of shapes combined with the influence of personality traits.
HERSHON and GIDDON (1980), through the simulation of profiles submitted for evaluation by patients — 42 orthodontically treated and 42 not orthodontically treated — concluded that, in this sample, the patients showed little or no concern about protruded lips.
BELL et al. (1985) examined eighty patients who had previously been evaluated by a surgeon and an orthodontist for orthognathic surgery. These patients completed questionnaires rating their own facial profiles. Half of the patients opted for surgical correction while the other half decided not to undergo surgery. In addition, booklets with photographs of the eighty patients were sent to 37 surgeons, 46 orthodontists, and 43 laypeople. These three groups of evaluators rated the facial profiles, using the same classification used by the patients. The results indicated that the patient's self-perception was more important in the decision to undergo surgery or not than the cephalometric measurements or the specialist's recommendation.
FARKAS and KOLAR (1987) stated that facial attractiveness is not an abstract concept but a quantitatively well-defined anatomical quality. A proportional face — one whose dimensions fall within the normal range (population mean plus/minus two standard deviations) — is healthy but not necessarily attractive. In an attractive face, the proportion indices fall within the range of the mean plus/minus one standard deviation. They concluded that the measurements of the middle and upper thirds of the face are relatively constant when evaluated from an esthetic point of view. The authors also noticed that beauty standards for the face viewed in profile are not static, showing changes over recent decades.
FARROW, ZARRINIA, and AZIZI (1993) digitally altered profile images of fifteen Black patients. These alterations were then submitted for evaluation by the patients themselves, orthodontists, general practitioners, and laypeople. These respondents evaluated and rated the profiles according to their own standard of beauty. From this sample, the authors concluded that Black Americans had a preference for straighter profiles — in contrast to what was considered normal for their race at the time — but which did not match the profile characteristic of the white race.
CZARNECKI, NANDA, and CURRIER (1993) carried out a study on the contribution of the nose, lips, and chin in achieving a harmonious facial profile. A questionnaire with androgynous facial silhouettes was evaluated by 545 dental professionals. The authors observed that these evaluators allowed a slight protrusion of the lips in those silhouettes with a prominent nose and chin and concluded that judgment of lip protrusion and retrusion depended on the positions of the chin and nose. The authors further showed that profiles with noticeable concavity caused by a large nose or chin, or retruded lips, were considered unpleasant. Another observation by the authors reports that in contrast to the public's preference for fuller lips, some orthodontists seek a straighter profile.
ROMANI et al. (1993) used a video processing technique to evaluate changes in the facial profile simulating the effects of various orthognathic surgery techniques. The resulting images were evaluated by 22 dental surgeons and 22 laypeople, to determine their level of sensitivity to the changes and their esthetic preferences. They concluded that both laypeople and dental surgeons were able to detect even small changes in the facial profile. They also noticed that orthodontists have greater sensitivity to horizontal profile changes than to vertical changes. In this work the authors cite that after the use of facial drawings, paper cutouts, wooden models, darkened photographs, and silhouettes, the orthodontist can make use of digital image processors.
HSU (1993) compared the consistency (lower variation) and sensitivity (ability to indicate differences) of five reference lines for evaluating horizontal lip position:
a) Ricketts E line — drawn from soft-tissue pogonion to pronasale; b) Steiner S line — extends from the center of the "S" curvature at the base of the nose — between pronasale and subnasale — and passes tangent to the chin; c) Holdaway H line — originating at soft-tissue pogonion, passes tangent to the upper lip; d) Burstone B line — drawn from subnasale to soft-tissue pogonion; e) Sushner S line — connects soft-tissue nasion to soft-tissue pogonion.
Through cephalometric analysis of one hundred photographs — selected by seven professionals from different fields — the author concluded that the five lines showed satisfactory sensitivity, denoting the ability to differentiate for both sexes, except for the Sushner line in the male group. The author reported that the Holdaway line was not satisfactory when comparing results between sexes. The author suggested that the relationship between nose, lips, and chin should be included in evaluating the harmony and balance of the facial profile.
SKINAZI, LINDAUER, and ISAACSON (1994) reported that a preference for a more anterior lip position in recent years is also observed in the plastic surgery literature, with an increase in case reports of lip augmentation. In this same work, the area of the facial profiles of 66 young adults was measured and the mean values of the component parts of the profile were compared. Among other references, they used the Ricketts "E" line — tangent to the tip of the nose and the most prominent point of the chin — together with a line connecting the deepest point of the nasolabial and mentolabial grooves — referred to by the authors as a creation of Juan Canut (Madrid) and thus called the "Juanita Line." The authors noticed that the area occupied by the nose in the female profiles was larger than the area occupied by the nose in the male profiles, in this sample. The contribution of chin area to the total profile area was greater in the male profile than the chin area in the female profile. When the percentage contributions of the lips were compared, they occupied approximately the same area of the facial profile in both men and women.
PERRETT, MAY, and YOSHIKAWA (1994) investigated whether there is a preference for faces presenting average characteristics. This theory, known as the Average Face Hypothesis or averageness, suggests that phenotypes with an average facial structure would be favored within the concept of natural selection. However, the authors believe that although an average face may be pleasing, it is not esthetically superior. Thus, in this study, using digital composites of average faces, the authors found a preference for those average faces that intentionally presented some exaggerated measurement. Evaluators of different races showed the same preferences in this regard, suggesting that esthetic judgments of the face are similar across different cultures. The authors conclude that average faces were not the most preferred by the population investigated, but rather those faces that had some characteristic that distinguished them.
OKUYAMA and MARTINS (1997) [article in Portuguese] investigated the facial esthetic preference of orthodontists, laypeople, and plastic artists, through the rating of 180 profiles belonging to young leucoderms, melanoderms, and xanthoderms. They used in their sample 180 photographs belonging to 60 young people of each race, 30 of each sex, aged between 17 and 35 years. These photographs were then submitted for evaluation by laypeople, plastic artists, and orthodontists. They cite that numerous professionals admit that the use of standards recommended in other countries does not represent a reliable guide for obtaining optimal esthetic results consistent with the sociocultural environment of patients in Brazil. They concluded that there was a preference for profiles with a mild facial convexity, greater for melanoderms and lesser for leucoderms; they further state that beauty can be defined as a state of harmony and balance of facial proportions, established by the skeletal structures, the teeth, and the soft tissues. In addition, they verified the existence of mild facial convexity — for all races — in the profiles preferred by the 27 evaluators.
According to PECK and PECK (1997), the term "esthetics" is derived from the Greek aisthesis, meaning "perception" or "sensation." The authors also reported that this word was used by Alexander Baumgarten in the 18th century, in a university treatise written in Latin. The term "aesthetica" entered the English lexicon with the Latinized digraph "æ," remaining as an affix of the Greek root. The silent "a" would later fall out of use.
ANDERSON, EVANS, and GIDDON (1999) evaluated whether the orientation of facial profile images — facing left or right — would have an effect on the perception of clinicians and patients regarding needs, outcomes, and treatment satisfaction. Right-profile images were obtained and digitized. From these, left-profile images were created by mirror-reversing the images. Over these images, subtle distortions of five facial aspects were created: upper lip, chin, bimaxillary position, lower anterior facial height, and mandible. Twenty-four evaluators voted on the acceptability of each profile, and the most pleasing image. No differences were found between the values obtained for choices on right or left profiles, with the exception of statistical differences for horizontal alterations, which were more significant in right profiles. They concluded that with the increased use of computerized images in dental clinics, the influence of psychophysical and environmental variables on perception must be considered.
VALENTIN, ABDI, and EDELMAN (1999) asked evaluators to memorize unfamiliar faces, seen from different angles. Recognition ability was evaluated by presenting the faces either in the same orientation or after a ninety-degree rotation, further associated with various types of distraction factors. The results showed that the effect of certain types of facial characteristics on face memorization depended on the viewing angle presented during memorization. They noticed that distinctive facial characteristics were better remembered in profile view than in frontal view of the face.
SCOTT and JOHNSTON Jr. (1999), with the aim of evaluating the impact of extractions on the facial profile, used groups of evaluators (white orthodontists and Black orthodontists, white laypeople and Black laypeople) who compared pre- and post-treatment facial profiles, quantifying the esthetic impact caused by treatment. The authors noticed that extractions would benefit profiles where the lower lip was 2 mm beyond the Ricketts E plane, for white patients, and 4 mm for Black patients. Their conclusions indicated that there is an important interaction between the type of treatment, the patient's race, and the observer's experience. The authors further stated that "facial beauty, apparently, lies in the hands of the orthodontist, in the eyes of the one who sees it, in the face of the one who has it."
AUGER and TURLEY (1999) measured 14 variables on profile photographs presented in fashion magazines during the 20th century, with the aim of evaluating changes in the white female facial profile. Five periods were studied, with a sample of 25 photographs from each period, having corrected the photographs for magnification and orientation. Significant differences were found for the antero-posterior position of the lips, the visible amount of labial tissue, and the interlabial angle, with the more recent groups presenting fuller and more anteriorly positioned lips. However, no significant differences were found for the measurements calculated above subnasale, such as the frontonasal angle, the nasal tip angle, and the nasolabial angle, nor for the relationship of the chin to the upper third of the face (total facial angle). They also observed that the chin and the upper part of the face had less influence on the public's facial preference compared to lip positioning. The results allowed the authors to conclude that the standards for white female facial profile esthetics are not static, and show a trend over the century toward fuller, more anteriorly positioned lips, as observed in profile photographs published in fashion magazines. In this work they also found a significant change in the esthetic preference of the North American public regarding the lip region. As their sample became more recent, they noticed a statistically significant difference between the various groups studied, always with a tendency toward slightly more projected lips. This lip projection, they comment, may be related to the perception of age, with fuller lips appearing more youthful. Another reason for this trend, they state, may be the racial mixing involved in the ethnic background of the sample members. They comment that the number of Black people prominent for their facial esthetic characteristics increased 450% over the last five decades. Another important observation is the possibility that such esthetic preferences reflect a trend of the entire Western population, and not only the North American population, since mass communication in international media tends to influence various nations equally.
HIER et al. (1999) used a sample of 53 young adults, with the aim of examining esthetic preferences for lip position in men and women — comparing these preferences with each other and with an orthodontic norm, using a computer program. Their sample consisted of 53 young adults, 25 of whom were male and 28 female. The sample was divided into patients with prior orthodontic treatment or without prior orthodontic treatment. The results were evaluated using ANOVA and Scheffé tests to determine differences between the responses of the various groups. In addition, "t" tests were used to compare the responses with a commonly used norm, the Ricketts "E Line." The results indicated differences between sexes, with women preferring more protruded lips than men, and patients without prior treatment also demonstrating a preference for more protruded lips. Additionally, both men and women preferred more protruded lips than those of the Ricketts norm.
KITAY et al. (1999) used computerized animations comparing self-perception images with those of orthodontic and non-orthodontic patients. They report that the use of photographs benefits from radiation-free resources for evaluation and decision-making regarding facial profile changes. The photographs used in their article were obtained in NHP. The photographs were then digitized and subjected to deformations of the lower third of the face for evaluation by adult volunteers who were interviewed — 16 orthodontic patients and 14 non-orthodontic patients — through a printed questionnaire. In evaluating the most pleasing profile, no significant difference was detected regarding the votes of male or female patients. They concluded that a computer program capable of presenting the face with apparent animation can be useful in diagnosis, counseling, and patient education regarding facial disharmony and anomalies. They found no statistically significant differences between the male and female profile considered most pleasing.
NOMURA et al. (1999) used a sample of 60 patients with normal occlusion, not orthodontically treated, and 88 orthodontically treated patients. The facial profiles were evaluated by 20 students and 20 orthodontists who rated them. The results indicated that pleasing profiles had the same frequency in both groups.
MAGANZINI, TSENG, and EPSTEIN (2000) investigated esthetic preference for the facial profile using digital video images. Their sample consisted of 85 Chinese laypeople, 38 women and 47 men. A series of four images (distortions) was constructed from an initial cephalogram. The facial profiles were then created using morphing techniques. The participants in this sample showed a preference for straight profiles, corresponding to the bimaxillary retrusion image — for the male face, while for the female face the image with an anterior divergent profile (or maxillary deficiency) was the most voted.
BOWMAN and JOHNSTON (2000), with the aim of comparing the esthetic effects of treatments with or without extractions, had 58 laypeople — selected from the authors' personal contacts — and 42 dentists participating in a continuing education course evaluate the profiles of 120 pre- and post-treatment patients, with the aim of evaluating whether there was a preference for more convex or straighter profiles, typical of extraction cases. These profile drawings of faces were shown randomly by slide projection or on printed sheets. They noticed in analyzing the results that laypeople appear less critical than dentists regarding facial esthetics. In this work the authors found a mean lip position of –2.3 mm from the E plane for patients with extractions and –0.5 mm for patients without extractions. They concluded that treatment with extractions can be beneficial for the profile.
MEJIA-MAIDL and EVANS (2000) commented that, of more than 35 cephalometric analyses published between 1937 and 1969, only one study reflected the opinion of the lay public regarding facial beauty — the work of RIEDEL (1957). Thus, these analyses reflected average faces, or the preference of the author who selected them, or even harmony, without characterizing the best or most beautiful face in the eyes of a given population. They also warned in that study of the influences of culture, time, and geographic location on the concept of beauty.
PAPASOTIRIOU, NATHANSON, and GOLDSTEIN (2000) compared the effectiveness of using digital resources versus conventional ones in treatment-proposal interviews through the responses of 35 respondents. The authors concluded that patient satisfaction was greater in cases using digital resources, but that this medium took more time to execute.
SPYROPOULOS and HALAZONETIS (2001), with the aim of evaluating the relative importance of the facial profile in facial attractiveness, made alterations to digitized photographs of 20 female patients. The resulting average profiles received hair from the original photographs and, once printed, were submitted for evaluation by 10 laypeople and 10 orthodontists, together with the initial photographs. The profiles created digitally, representing the average of the facial characteristics, received the highest scores.
2.3 Studies on samples obtained through digital media
KEHOE and PITKOW (1995) found that the use of surveys posted on on-line pages has resulted in a large number of responses, greater than that obtained through conventional means.
SCHILLEWAERT, LANGERAK, and DUHAMEL (1998) observed a higher response rate in questionnaires that use the graphic advantage of languages such as HTML and Javascript, creating attractive, interesting, and inviting questionnaires. They also comment that, since there is no need for an interviewer to be present, interviewer-induced error is minimized, since respondents fill in their own answers directly.
McCULLOUGH (1998) observed that on-line surveys obtain larger numbers of responses in a shorter period of time. He also states that since there is no interviewer, interviewer-induced error is minimized, since the evaluators themselves fill in their responses, resulting in more reliable data. Thus, according to the author, the interviewer's influence on the responses is eliminated, since their interest, mood, or opinion will not be reflected in the data.
BRADLEY (1999), suggesting an organization of the types of questionnaires that can be sent by electronic media, indicated some classifications according to the location of the questionnaire or its distribution:
a) type I, an Internet page open to any visitor; b) type II, an Internet page open only to invited participants; c) type III, a hidden page, activated randomly.
The author also described three types of survey that use electronic mail:
a) type I, a simple message with questions; b) type II, the questionnaire attached to a simple message; c) type III, the questionnaire can be visited from a command in the message received by the recipient.
From these related presentations, the author asserted that one can control variables and limitations concerning the obtainment of the sample. In conclusion, the researcher stated that, using the appropriate method, one can obtain a significant probabilistic sample, provided that the electronic addresses of the individuals interviewed have been selected randomly.
SHEEHAN and HOY (1999), stating that the potential of the Internet for research among populations has recently become accepted, used electronic means to obtain and study a nationwide — North American — sample. The authors state that the Internet's adoption rate is higher than any technology that preceded it. They report that for radio to reach fifty million people took thirty-eight years; for television to reach that audience took thirteen years, while the Internet reached fifty million users in only four years. From this statement, they suggest that the Internet presents enormous potential for interaction between its users and researchers. From 5,000 electronic invitations, they obtained a response rate of 24 percent. Of these respondents, seventy percent were men and thirty percent women. The authors concluded that electronic questionnaires can be a viable means for large-scale research.
The authors further listed the characteristics that can be observed in Internet-based research:
a) posted on Web pages, they can collect demographic information, psychographic information, and opinion data; b) they use the graphic advantage of languages such as HTML and Javascript, creating attractive, interesting, and inviting questionnaires, as found by Schillewaert, Langerak, and Duhamel (1998); c) the use of surveys posted on Web pages has resulted in a large number of responses, according to Kehoe and Pitkow (1995), in a short period of time (McCullough, 1998); d) except for the initial cost of the equipment, surveys cost less per respondent, in addition to the equipment acquired for the survey being able to simplify data analysis, since it transfers responses directly from the questionnaire to the statistical analysis program; e) respondent privacy is preserved, since the respondent can choose whether or not to identify themselves, which, according to Kiesler and Sproull (1986), positively affects the number of responses obtained; f) since there is no need for an interviewer to be present (Shillewaert, Langerak, and Duhamel, 1998), interviewer error is minimized, since respondents fill in their responses directly, resulting in more reliable data (McCullough, 1998); g) likewise, the interviewer's influence on the responses is eliminated, since their interest, mood, or opinion will not be reflected in the data (McCullough, 1998); h) duplicate responses can be eliminated through programming of the receiving equipment.
COUPER (2000) reported that traditional methods of data collection for research have been undergoing changes, with the great proliferation of on-line surveys. The possibility of collecting data on a large scale is no longer restricted to large organizations. The author warned that the quality of Internet surveys varies greatly, from informative questionnaires to advanced surveys aimed at describing a population. In this work, the author described various types of research by electronic media, their limitations, and advantages. Among the most reliable methods of digital research, according to the author, are the probabilistic methods — more specifically those that use broad-coverage samples, based on lists of individuals. The author cites that this method can, for example, use a list of individuals with Internet access. Invitations to participate are sent by electronic mail, and access is controlled to prevent duplicate votes from the same respondent or their forwarding the invitation for other individuals to respond. According to the author, this type of restricted population does not present coverage problems, that is, it achieves high response rates. The author concluded by suggesting that one should be familiar with the various methodologies of digital media research, their limitations and advantages, and the possibility of generalizing the results obtained.
COUPER, TRAUGOTT, and LAMIAS (2001) studied the effects of differences in questionnaire design — carried out via electronic means — on the different results obtained. They sent 1,602 electronic invitations to participate in a survey whose questionnaire was located on an Internet page. Three experiments based on the appearance of the questionnaires were carried out. One of the experiments compared the effect of the presence or absence of a progress indicator for each question answered. The second experiment allowed the visualization of one question at a time, or all questions at once. The third investigation compared responses given through "on/off" buttons with responses written in blanks by the respondents. The results allowed the authors to conclude that there was no statistically significant difference regarding the presence of a progress indicator between each question, nor regarding whether several options were listed in the same questionnaire. Regarding whether options were marked with buttons or filled in as text, the authors concluded that the use of buttons ensured a greater number of completed questionnaires, with fewer blank responses per question.
HANCOCK and FLOWERS (2001), with the aim of comparing the reliability of results from surveys carried out by electronic media and by paper questionnaires, carried out a study using a sample of 178 people, whose mean age was 34.2 years. The questionnaires were initially presented to 283 evaluators, of whom 181 answered the questionnaire (response rate of 64%) and three returned it unanswered. Additionally, the effect of respondent identification or anonymity was also tested by comparing the responses of four groups:
a) digital questionnaire, anonymous respondent; b) digital questionnaire, identified respondent; c) paper questionnaire, anonymous respondent; d) paper questionnaire, identified respondent.
After comparing the responses obtained both by electronic questionnaires and by paper questionnaires, the authors concluded there was no statistically significant difference between the two types of instrument or influence on the results from the fact that the respondent had been identified.
KOCH and EMREY (2001), with the aim of evaluating the possibility of generalizing the results of on-line surveys, and observing whether there were selection biases in these samples, compared official population data with the demographic data collected in their study. They used a logistic regression model to determine whether there were differences between participants and non-participants in the sample. They observed that the demographic characteristics of those who participated in the survey were practically indistinguishable from those who did not participate in the sample. They also report that their questionnaires' response rate was 16.4 percent, similar to the response rate for paper questionnaires. From the results, they concluded that the Internet offers a reliable means of population research.
ETTER and PERNEGER (2001) compared the characteristics of individuals in samples obtained via the Internet (n=1,027), by mail nationwide (Switzerland, n=19,352), and by mail in the country's capital (Geneva, n=211). In this study on behavioral changes, participants completed questionnaires on the Internet or on paper, depending on the group to which they belonged. The authors concluded that epidemiological data collection on the Internet proved efficient and low-cost, providing reliable data and a sample of considerable size. They further state that Internet recruitment proved to be a potentially useful method for analytical studies whose focus is on the associations between the variables studied.
YEAWORTH (2001) carried out a study on the use of electronic questionnaires with carriers of rare diseases using data provided through the Internet, obtaining a response rate of 68%. The author states that the potential use of the World Wide Web for research on diseases whose carriers are rare became evident. The author made available an instrument for collecting information about the affected person and their family. The author found that the responses were similar to information obtained through other means, increasing confidence in the validity of the sample and the responses. The author concluded that this type of research can provide reliable information and suggests the use of this type of research in other areas.
HORSWILL and COSTER (2001) investigated the use of three types of instrument for behavioral evaluation, via the Internet. They evaluated differences in the responses obtained by instruments containing respondent-controlled photographic animations, questionnaires with static illustrative photographs, or purely text-based electronic questionnaires. These three types of instrument were completed via the Internet. The purpose of the questionnaires was to determine the existence of behavioral changes in respondents. For comparison purposes, the authors compared these responses to a sample obtained by the traditional "pencil and paper" method. No significant differences were found. The results of the questionnaires that had photographs and animations reflected demographic behavior patterns known in psychology studies.
YAMANAKA et al. (2001) investigated differences of opinion — regarding indication for surgical intervention — among 93 medical professionals. Using a questionnaire published on the Internet, presenting a clinical case, they collected opinions from 43 orthopedists and 50 orthopedic residents. The authors report not having found differences between the choices made by residents or orthopedists. Although opinions showed some divergences among younger physicians, the great majority agreed in determining the procedures to be performed. The authors concluded that the use of on-line questionnaires for discussing clinical cases should be considered.
ANGELO and CITKOWITZ (2001) carried out a survey using on-line clinical discussion groups, with approximately two hundred thousand registered physicians. The authors used a questionnaire published on the Internet, which presented eight multiple-choice questions about a clinical case, in addition to collecting information about the respondent. Analyzing the responses of 586 participants, the authors concluded that discussion groups represent a resource to assist decision-making among medical professionals.
BLIVEN, KAUFMAN, and SPERTUS (2001) carried out a study to evaluate the use of on-line data collection tools compared to traditional questionnaires. The questionnaires were completed on paper and in electronic format by 55 patients in a public hospital. The results indicated that the instruments obtained similar results (p<0.01) in all aspects observed. The authors observed that computer skill, level of education, age, sex, and ethnicity were not significantly associated with the ability to properly complete computer-assisted questionnaires. In addition, eighty-two percent of the patients preferred the computerized system. The authors concluded that data collected via the World Wide Web were reliable and valid, comparable to those obtained in the traditional paper format.
3 METHODOLOGY
3.1 Material
The equipment used in this investigation consisted of:
a) microcomputer: – Intel® Pentium® III processor, 750 MHz; – 128 Mb of RAM memory; – 30 Gb Quantum "Fireball®" hard disk; – 17-inch flat-screen Samsung "SyncMaster® 750s" monitor; – Creative "Riva TNT2 Nvidia® M64" 3D video card; – Microsoft "Intellimouse" optical mouse; b) 3Com "HomeConnect®" ADSL modem; c) permanent LAN Internet connection at 256 Kbit/s; d) Genius "ColorPage® Vivid-Pro II" scanner; e) Epson "Stylus® Color 670" printer; f) Summagraphics "Summasketch® III" digitizing tablet; g) Microsoft "Windows Millennium®" operating system, Portuguese version; h) mechanical pencil with black "HB" lead, 0.5 mm diameter; i) computer programs: – Microsoft "Outlook Express®" e-mail client; – Symantec "Norton Antivirus 2000®" antivirus program; – ElcomSoft "Advanced Direct Remailer®" message-dispatch program; – JASC "Paint Shop Pro® 5.0" image processing and editing program; – Cerious "Thumbs® Plus 4.5" image processing program; – "Hitbox® Professional" on-line statistics program, Websidestory; – "SPSS® for Windows 8.0" statistical analysis program; – "Dentofacial Planner Plus®" cephalometric analysis program, from Dentofacial Software.
3.2 Method
3.2.1 Obtaining the Initial Photograph
The standardized photograph was obtained with a Pentax® 35 mm camera, at 1.5 m from the patient's face, according to the method described by FARKAS (1994). The model, aged twenty-one years and eleven months, is white and has at least three generations of ancestors residing in the country. Her occlusion presents an Angle Class I molar relationship, and she had not undergone prior orthodontic treatment. The model was instructed to focus on a distant point, after slowly oscillating the head position up and down, with the aim of reproducing a Natural Head Position (NHP) as described by MOORREES and KEAN (1958). She was further instructed to allow the lips to touch gently (PECK and PECK, 1970). Ambient fluorescent lighting and flash were used. The resulting profile photograph (Figure 1, page 54) was digitized and used to produce the other images used in this study.
The right facial profile was selected for standardization purposes, since prior studies have shown that the side toward which the face is turned has little effect on evaluators' perception (ANDERSON, EVANS, and GIDDON, 1999).
3.2.2 Digitization and Processing of the Initial Image
The profile photograph was digitized on a Genius scanner, model ColorPage® Vivid-Pro II, set to an optical capture resolution of 600 dots per inch, without interpolation, ensuring sufficient final quality, since the computer monitors on which the images were evaluated use resolutions below one hundred dots per inch. In order to orient the original photograph on the scanner and standardize the position of the image for editing and evaluation, a line was established extending from the superior attachment of the model's ear to the outer corner of the eye, parallel to the Frankfort Horizontal Plane (FHP), as confirmed by CLAMAN, PATTON, and RASHID (1990). This procedure allows the image to be edited and evaluated with the FHP parallel to the ground, even if the initial image was obtained in Natural Head Position. In this particular case, the Frankfort Horizontal Plane was already parallel to the horizontal when the model was photographed in Natural Head Position, eliminating the need for correction.
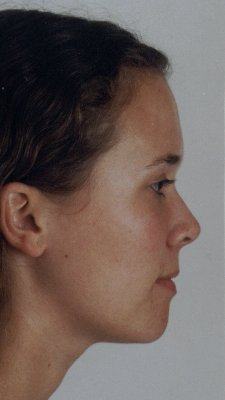
The excess portions of the initial image were removed based on the following limits: Left – posterior visible border of the ear, pixels 441x990. Bottom – anterior prominence of the glottis. Top – the original limit of the initial photograph was retained. Right – the original limit of the initial photograph was retained.
The image obtained from the scanner was saved in "TIFF" (Tagged-Image File Format), uncompressed. All subsequent images derive from this initial image.
3.2.3 Creation of the Images with the Profiles to Be Evaluated
The images presented for evaluation were edited with the aim of representing discrete distortions of certain characteristics of the lower third of the soft-tissue facial profile. Four soft-tissue reference points, called "cut points," were marked on the initial image, thereby delimiting five zones corresponding to bands that, once shifted, produced different facial profiles. A digital image-processing program (Jasc) was used for these procedures.
Cut points were defined at Subnasale (Sn), Stomion (St), soft-tissue Point B (B'), and soft-tissue Menton (ME'). No structure above Subnasale was altered, allowing the middle and upper thirds of the face to remain the same for all resulting images. These fixed structures served as a reference for the comparative superimposition of the final images shown to the evaluators. Horizontal bands were then created corresponding to the maxilla and upper lip (cuts at Sn and St), upper lip and lower lip (cuts at Sn and B'), lower lip and chin (cuts at St and ME'), and the entire lower third of the face (cuts at Sn and ME'). This band corresponding to the lower third of the face was subjected — in addition to horizontal movement in two images — to vertical alterations. Cut and seam lines were eliminated, when necessary, through a specific tool, using the smudge effect of the image manipulation program, maintaining a natural appearance (ROMANI et al., 1993).
Two distortions were created for each band, from the original image, measuring eleven pixels more or less. With the exception of the antero-inferior facial height (Sn–ME'), where the distortion was vertical, decreasing or increasing the lower third by 11 pixels, the alterations occurred in the antero-posterior direction, more and less, creating aspects of antero-posterior reduction or increase of 11 pixels for each characteristic. The choice of measurements in pixels ensured the reproducibility of the changes across different monitor resolutions. The selection of 11 pixels for the distortions was established to ensure that the changes were perceptible — even to laypeople — without becoming obvious, ensuring opinions based on subjective, intuitive aspects of the participant, as noted by HSU (1993) and by HIER et al. (1999). On monitors with "800x600" resolution, this variation corresponds to 2 mm more or less on the original profile image. On monitors with a resolution other than 800x600, the alterations will still present 11 pixels, maintaining proportionality with the other facial structures.
The color, contrast, brightness, and other characteristics of the original image were kept unaltered in all images presented.
The upper lip (LS) was altered in the anterior and posterior directions (Figures 2 and 3, page 57). Similar alterations were made for the combinations formed by both lips (Figures 4 and 5, page 58), by the lower lip and chin (Figures 6 and 7, page 59), and by both lips and chin (Figures 8 and 9, page 60). In addition, the lower facial height was modified vertically (Figures 10 and 11, page 61). Although the images presented are approximately two-thirds the actual size of the head, they acceptably represent the changes to the original profile.
None of the alterations was intentionally combined, since each resulting image presents only a movement of plus 11 pixels or minus 11 pixels for each band. Thus, the final images evaluated present, for each band moved, 22 pixels of alteration between the most retruded and the most protruded position.
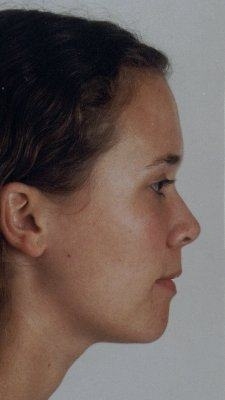
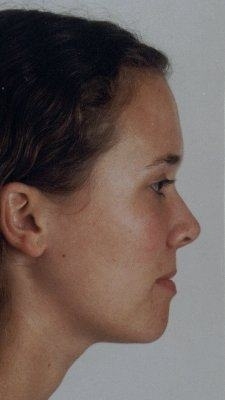
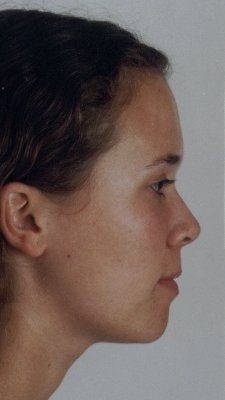
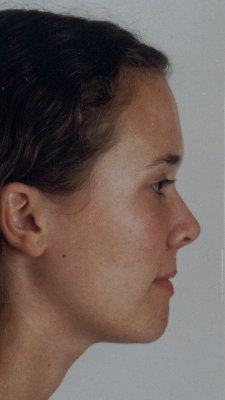
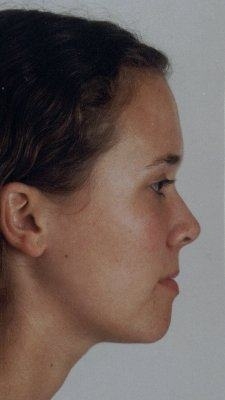
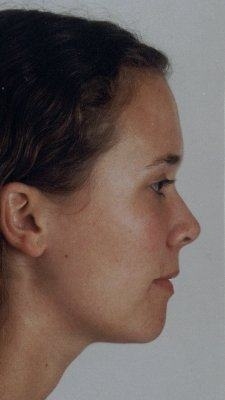
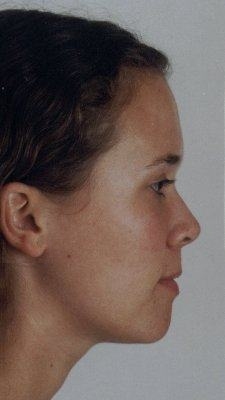
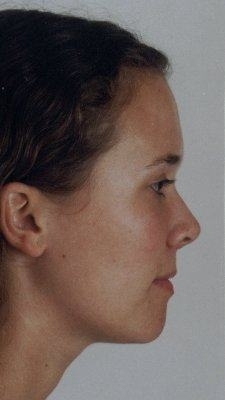
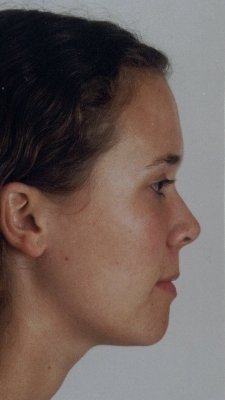
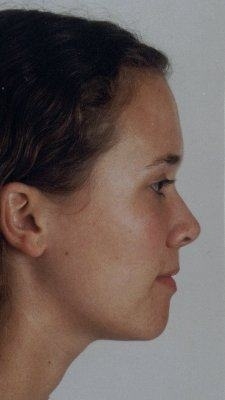
3.2.4 Cephalometric Analysis
3.2.4.1 Manual Cephalometric Analysis of the Evaluated Images
The resulting images were printed with a color standard suitable for printing (CMYK), on white alkaline A4 paper of 90 g/m² (Chamex), using an Epson Stylus Color 670 printer. The printing resolution used was three hundred dots per inch (DPI).
These printouts allowed the cephalometric analysis of each of the images.
To allow analysis of the digitally created facial profiles, eleven reference points were determined (Chart 1, below), both on the image obtained from the scanner and on the images resulting from digital editing.
The cephalometric points were selected solely on soft tissue, without regard to the corresponding skeletal anatomy, as suggested by AUGER and TURLEY (1999).
A single investigator performed the cephalometric tracings on the printed images, using a mechanical pencil with 0.5 mm black HB lead. The soft-tissue points were marked by the same investigator.
To estimate the investigator's error in the tracings, point location, and measurements, all images were traced and measured again on two further occasions, on different days and times, using incandescent and fluorescent lighting. The means and errors were compared between the evaluations, resulting in a mean angular error of 0.5º and a linear error of 0.3 mm.
Angular measurements were performed with a ruler combined with a protractor of the Unitek brand, graduated to 0.5º. Four angular measurements were performed, measuring the internal angle formed by the lines, except for the Facial angle.
Chart 1 – Points used in the manual cephalometric analysis and their location according to the authors who described them
| Point (original abbreviation) | Localization method used by the describing author |
|---|---|
| Soft-tissue Glabella (GL') | The most anterior or prominent point in the mid-sagittal plane of the forehead at the level of the upper orbital rims (BHATIA and LEIGHTON, 1993). |
| Soft-tissue Nasion (SFN) | The deepest point of the concavity corresponding to the region of the frontonasal suture (BHATIA and LEIGHTON, 1993). |
| Pronasale (PRN) | The most prominent or anterior point of the nasal tip (BHATIA and LEIGHTON, 1993). |
| Subnasale (Sn) | Point located at the junction of the lower border of the nose and the upper lip, in the mid-sagittal plane (BHATIA and LEIGHTON, 1993). |
| Soft-tissue Point A (A') | The deepest point on the upper lip determined by an imaginary line between subnasale and labrale superius (BHATIA and LEIGHTON, 1993). |
| Labrale superius (LS) | The most anterior point of the upper lip (CHACONAS, 1980). |
| Stomion (St) | The midpoint of the mouth when the lips are closed (CHACONAS, 1980). |
| Labrale inferius (LI) | The most anterior point of the lower lip (CHACONAS, 1980). |
| Soft-tissue Point B (B') | The point of greatest depth of the concavity between labrale inferius and soft-tissue pogonion (BHATIA and LEIGHTON, 1993). |
| Soft-tissue Pogonion (Pg') | The most prominent or anterior point of the soft-tissue chin in the mid-sagittal plane (BHATIA and LEIGHTON, 1993). |
| Soft-tissue Menton (ME') | The most inferior point of the soft-tissue chin (BHATIA and LEIGHTON, 1993). |
3.2.4.2 Angular Measurements Used
Nasolabial angle: the angle formed by the intersection of a line drawn from Subnasale to the point of greatest tangency of the columella of the nose, and a line from Subnasale to the most anterior point of the upper lip. This measurement is taken with the lips relaxed (BURSTONE, 1967).
Labial angle: measured between the lines drawn from LS to St and from St to LI.
Mentolabial angle: measured between the lines drawn from LI to B' and from B' to Pg'.
Facial angle: the angle formed by the intersection of a line drawn from the soft-tissue Glabella (GL') to Subnasale (Sn), and a line from Subnasale to the soft-tissue Pogonion (Pg'). This angle was described by BURSTONE (1958) and by LEGAN and BURSTONE (1980). This angle was measured between the GL'–Sn line and the upward extension of the Pg'–Sn line.
Except for the Columella, the lines for angular measurements were drawn using the anatomical-points method, which is more reliable than the tangent-lines method (HWANG, KIM, and McNAMARA Jr, 2000). The tangent-lines method was used only to draw the line of the nasal base, over the Columella (BURSTONE, 1967).

3.2.4.3 Computerized Cephalometric Analysis of the Evaluated Images
For purposes of comparing cephalometric values, the eleven printed images were transferred to the Dentofacial Planner Plus cephalometric analysis program (Dentofacial Software). Following the user manual's instructions, a selection of cephalometric points was created through the specific "DFP Tools" tool (Dentofacial Software). The printed images were positioned on the digitizing tablet (Summagraphics) and the points entered by the same operator. The results were tabulated and compared with each other and with the values obtained through the manual cephalometric analysis. The cephalometric points used in the computerized analysis of the facial profile are illustrated in Figure 13 below.

3.2.5 Development of the Questionnaire
The digital questionnaire was developed in HTML (HyperText Markup Language), allowing it to be sent by e-mail and posted on the Internet without requiring modifications between applications.
The questionnaire (Figure 14, page 69) was presented as a single page, with a structure aimed at avoiding order and context effects, in addition to minimizing the effort and time spent by the evaluator (COUPER, TRAUGOTT, and LAMIAS, 2001). The entire form could be completed using the mouse, without use of the computer keyboard, avoiding typing errors. All precautions were considered and combined with other resources, since the design of the research instrument can be extremely important in obtaining reliable responses. Images and colors were also used, along with interactive components that provided immediate results to the respondent's actions.
The questionnaire was created presenting the eleven images to be evaluated. For use in the questionnaire, the images were processed and saved in JPEG format so as to present 15% compression, with standard, non-progressive encoding, using the "RGB" color standard. The compression rate selected considerably reduced the storage and transfer size of the images, without presenting a quality reduction perceptible to the human eye, since it still had a resolution higher than that found on the evaluators' monitors.
A pre-test involving a total of one thousand selected e-mail addresses revealed that 49% of recipients did not respond within the allotted time and 51% responded to the questionnaire. The traditional formula for calculating the sample size necessary to adequately represent a population (ZIKMUND, 1991) was used and resulted in a target sample of 864 addresses with a 95% confidence level. Thus, considering a 51% response rate, approximately two thousand e-mail addresses should be sent. To compensate for non-existent addresses and eventual response refusals, five thousand addresses were selected.
The questionnaires (Figure 14, following page) were sent by e-mail to a control group of two hundred thirty evaluators. A copy of the questionnaire was posted on the Internet, at a location not previously disclosed, for evaluation by the second group, consisting of 4,770 evaluators, invited through a simple electronic message. This distinction allowed the results to be compared with respect to the methodology used and served for the statistical comparison of results. Invitations and their respective responses were marked with serial numbers allowing control of various variables, with redundant safeguards restricting votes to the invited individuals. The invitations also carried an indicator marking "SUE" (Scientific Unsolicited E-mail) that distinguished them from other types of e-mail (SHEEHAN and HOY, 1999). The name of the institution was intentionally omitted, avoiding the inducement of bias due to the respondent's affinity, or lack thereof, with this university.
These questionnaires were made up of three sections, or parts, described below. Figure 14, on the following page, illustrates the questionnaire presented to evaluators, with one of the images shown as selected, for illustration purposes. In the electronic version (Appendix 1), the questionnaire was received with no image apparent, i.e., no option pre-activated.

3.2.5.1 Digital Questionnaire – First Part
The first part consisted of an informative introduction and instructions for completing the questionnaire. Since this study sought an intuitive opinion, based on the evaluator's perception, an effort was made to provide a minimum of instructions, allowing the evaluator to express their choice without inducing bias from structural errors in the questionnaire's design (SUSIN and RÖSING, 1999, p. 37).
3.2.5.2 Digital Questionnaire – Second Part
The second part presented a column with the eleven resulting images, in thumbnail form, to be used as guides for selecting the larger images. This column of thumbnails served as a navigation tool among the eleven options presented, since, following the instructions, the evaluator could use them to view the larger images. The size of the thumbnails intentionally did not allow the selection to be made from these reduced versions. The use of thumbnail images allowed the creation of an analog guide, avoiding the use of sequential numbering (a logical guide) that could induce more votes for a given image for reasons other than the evaluator's preference.
The eleven larger images, produced for evaluation with a size of 225x400 pixels, had their display controlled by specific programming algorithms so that they would only become visible through the evaluator's direct action — who, upon passing the mouse over the respective thumbnails, would view its corresponding larger version. This feature allowed greater interactivity for the evaluator and prevented the simultaneous viewing of two images, avoiding the evaluator making choices based on the average of the alterations presented or even by directly comparing them. Thus, the programming applied to the image selection intentionally prevented direct comparison between two or more images, since each option overlaid the previous one. In addition, the arrangement of the images in the questionnaire was determined by computer randomization (SUSIN and RÖSING, 1999) through random-number-generating programming, which minimized order effects on the sample. This arrangement was determined for each questionnaire sent, thereby reducing the influence of image position on the distribution of votes. The programming used in the questionnaire ensured that, even though the images received by the evaluator were arranged randomly, the receiving computer would always receive them according to the order presented in Chart 2, below. This arrangement was used and maintained throughout the remainder of the present study. Additionally, each thumbnail had, next to it, a blank field to be marked for the most pleasing profile. The use of blanks in the form of a selection button avoided values outside the expected range (COUPER, TRAUGOTT, and LAMIAS, 2001).
Chart 2 – Arrangement of the Images after the initial randomization
| Characteristic | Corresponding Figure | |
|---|---|---|
| Image 1 | Projection of the lower lip and chin | Figure 6, page 59 |
| Image 2 | No alterations | Figure 1, page 54 |
| Image 3 | Retrusion of the lower lip and chin | Figure 7, page 59 |
| Image 4 | Vertical decrease of the lower third of the face | Figure 11, page 61 |
| Image 5 | Projection of the upper lip | Figure 2, page 57 |
| Image 6 | Retrusion of the lower third of the face | Figure 9, page 60 |
| Image 7 | Retrusion of the upper lip | Figure 3, page 57 |
| Image 8 | Projection of the lower third of the face | Figure 8, page 60 |
| Image 9 | Projection of the upper lip and the lower lip | Figure 4, page 58 |
| Image 10 | Vertical increase of the lower third of the face | Figure 10, page 61 |
| Image 11 | Retrusion of the upper lip and the lower lip | Figure 5, page 58 |
3.2.5.3 Digital Questionnaire – Third Part
The third part presented blanks for filling in age group, sex, ethnicity, region of the country, and occupation. Also included in this third segment was the image of a button with the words "Submit Response," linked to an HTML command to allow automatic submission of the vote.
As a primary measure to prevent duplicate votes, Javascript (Sun Microsystems) commands were used to prevent the questionnaire from submitting more than one vote.
As a secondary measure to prevent duplicate votes, the receiving computer was programmed to block new votes from the same evaluator's computer. After each evaluation, the programming employed generated a record that informed the voting server computer of any attempt at a duplicate vote. This line of code self-terminated on the day data collection ended.
Even if such safeguards were to be bypassed, another, redundant, safeguard was used, in which numbers generated by multiplying the IP (Internet Protocol) number by the vote's serial number would indicate to the receiving computer that this message should be discarded from the sample, being filed separately. Thus, the votes had serial numbers and could be identified one by one if it became necessary to identify duplicate votes.
The receiving computer, through a permanent Internet connection, instantly collected each vote, distributing it into virtual folders of the Outlook Express e-mail program. Votes originating from the group of two hundred thirty evaluators who voted by e-mail were stored separately from the two thousand votes received through the on-line questionnaire. Personal contacts of evaluators and responses to invitations were automatically stored in folders created for this purpose.
Authorized by the configuration of the evaluators' browser software, additional data were collected (Appendix 1), such as the response time to the invitation, the time taken to select the preferred profile, the evaluator's monitor resolution at the moment of selection, and the operating system and browser version used by each respondent, through Javascript (Sun Microsystems) programming combined with a real-time statistics program (Websidestory), which, among other uses, allowed the veracity of certain data to be assessed by cross-referencing the information provided with that collected automatically. This information was stored in a virtual folder created for this purpose, on the same computer that collected the votes.
The survey did not ask the respondent to identify themselves, nor did it use any method that would identify the evaluator by name. All control algorithms used variable-control resources that did not identify the evaluator personally. However, respondents could volunteer, through a final blank field, for future information-collection interviews, thereby forming a list of e-mail addresses of volunteers that could be used for future investigations carried out by this institution. In this case the evaluator had their e-mail address recorded, in a folder created for this purpose.
3.2.6 Statistical Analysis
Once the evaluators' opinions were received and the image with the highest number of votes was identified as representing the evaluators' esthetic preference among the options offered, this image was compared to the others to determine the statistical differences justifying this choice. Other data, such as sex, age group, region, ethnic origin, and occupation, were analyzed.
The results were analyzed using Chi-square tests, to evaluate significant association between qualitative variables, and the Logistic Regression test, to evaluate the influence of each facial characteristic on the evaluator's choice. The adjusted residual was additionally evaluated, comparing the observed results with the expected results.
4 RESULTS
Of the 5,000 invitations sent, 3,987 were confirmed opened within the allotted time (30 days). Of these opened invitations, 2,041 resulted in a completed vote, representing a response rate of 51.2%, as shown in Table 1.
Table 1 – General information on the data obtained
| Total invitations sent | 5000 |
| Invitations opened in time (30 days) | 3987 |
| Total valid votes received | 2041 |
| Votes with image selected | 2022 |
| Votes with no image selected | 19 |
| Incomplete votes | 81 |
| Agree to participate again | 991 (48.6% of votes received) |
| Do not wish to participate again | 134 (6.6% of votes received) |
To begin the analysis, an overall evaluation of the frequencies assigned to the images was carried out to check whether one image had a significantly higher choice frequency than the others. The results of this evaluation are in Table 2 (below), which presents the distribution of votes received by the 11 images proposed in the experiment. This table thus presents the simple frequency (number of votes received) and the relative or percentage frequency of votes received relative to the total votes. In parentheses is the adjusted residual. The adjusted residual calculates a relationship between the observed and expected frequency in standard deviations. The adjusted-residual value can be compared with a Normal distribution, where residual values greater than +1.96 indicate a frequency higher than expected relative to the other categories compared.
Table 2 – Distribution of vote frequency by image
| Image | Not chosen — Freq. | Not chosen — % | Not chosen — Adj. residual* | Chosen — Freq. | Chosen — % | Chosen — Adj. residual* |
|---|---|---|---|---|---|---|
| 1 | 1976 | 9.8% | (11.2) | 46 | 2.3% | (-11.2) |
| 2 | 1762 | 8.7% | (-6.2) | 260 | 12.9% | (6.2) |
| 3 | 1799 | 8.9% | (-3.2) | 223 | 11.0% | (3.2) |
| 4 | 1408 | 7.0% | (-34.9) | 614 | 30.4% | (34.9) |
| 5 | 1891 | 9.4% | (4.3) | 131 | 6.5% | (-4.3) |
| 6 | 1847 | 9.1% | (0.7) | 175 | 8.7% | (-0.7) |
| 7 | 2005 | 9.9% | (13.5) | 17 | 0.8% | (-13.5) |
| 8 | 1947 | 9.6% | (8.8) | 75 | 3.7% | (-8.8) |
| 9 | 1747 | 8.6% | (-7.4) | 275 | 13.6% | (7.4) |
| 10 | 1953 | 9.7% | (9.3) | 69 | 3.4% | (-9.3) |
| 11 | 1885 | 9.3% | (3.8) | 137 | 6.8% | (-3.8) |
| Total | 20220 | 100% | 2022 | 100% |
Adjusted residuals above 1.96 correspond to the value of the Normal distribution with more than 95% confidence.
For Table 2 (above), the image (categories 1 to 11) is compared with the individual's choice option, made from two categories: chosen (voted for) and not chosen (not voted for).
Graph 1, below, illustrates the frequency of evaluators' votes, showing the distribution of choices among the options made available.

A Chi-square test verified a significant association between vote frequency and the chosen image. The test value was χ²(10,1) = 1661.30 (p<0.001), leading to the conclusion that vote frequency is associated with the image; therefore, the images with more votes are significantly more preferred than the others.
4.1 Images with greatest preference
The most voted image was Image 4 (30.4% of votes), followed by the options: Image 9 (13.6% of votes); Image 2 (12.9% of votes); and Image 3 (11% of votes). These images are associated with adjusted residuals greater than 1.96, that is, they have frequencies significantly higher than would be expected if there were no preference. Table 3 presents the characteristics of the most preferred images.
Table 3 – Characteristics of the images with greatest preference
| Image | Votes | Adjusted Residual* | Nasolabial Angle | Labial Angle | Mentolabial Angle | Facial Angle |
|---|---|---|---|---|---|---|
| 4 | 614 | +34.9 | 112º | 105º | 146.8º | 12º |
| 9 | 275 | +7.4 | 117º | 103.7º | 144.9º | 14.5º |
| 2 | 260 | +6.2 | 118.8º | 102.1º | 152º | 15.5º |
| 3 | 223 | +3.2 | 121.1º | 99º | 152º | 16º |
Adjusted residuals above 1.96 correspond to the value of the Normal distribution with more than 95% confidence.

The graphs below present the variation of the Nasolabial (Graph 3), Labial (Graph 4), Mentolabial (Graph 5), and Facial (Graph 6) angles according to image preference, from the image with the fewest votes among the most preferred (Image 3) to the most voted (Image 4).


4.2 Images with least preference
Likewise, the images with significantly lower choice were: Image 7 (0.8% preference), Image 1 (2.3%), Image 10 (3.4%), Image 8 (3.7%), Image 5 (6.5%), Image 11 (6.8%). These images are associated with adjusted residuals lower than –1.96, that is, they have frequencies significantly lower than would be expected if there were no preference.
Table 4 – Characteristics of the images with least preference
| Image | Frequency (not chosen) | Adjusted Residual* | Nasolabial Angle | Labial Angle | Mentolabial Angle | Facial Angle |
|---|---|---|---|---|---|---|
| 7 | 2005 | -13.5 | 115 | 101 | 143.2 | 9.1 |
| 1 | 1976 | -11.2 | 119 | 103.5 | 151 | 11.5 |
| 10 | 1953 | -9.3 | 116.5 | 103.7 | 143.5 | 14.1 |
| 8 | 1947 | -8.8 | 123 | 106.3 | 150.5 | 14.1 |
| 5 | 1891 | -4.3 | 117 | 95.4 | 148 | 16 |
| 11 | 1885 | -3.8 | 119 | 104 | 142.2 | 10 |
Adjusted residuals below -1.96 correspond to the value of the Normal distribution with more than 95% confidence.

A Chi-square test verified the significant association between vote frequency and the chosen image. The test value was χ²(10,1) = 1661.30 (p<0.001), leading to the conclusion that vote frequency is associated with the image; therefore, the images with fewer votes are significantly less preferred than the others.
4.3 Frequency of votes by sex, male or female
A Chi-square test verified the existence of a significant preference association between image and sex. The test value χ²(10,1) = 30.393 (p<0.001) attests to an association between sex and image. Males had a higher frequency than females for Image 1 and Image 4. Female respondents chose Images 5 and 8 with greater frequency relative to the votes of male respondents. Table 5 (below) presents the distribution of vote frequency by sex. Graph 8 illustrates the preference by sex.

Table 5 – Distribution of vote frequency by sex
| Image | Male — Freq. | Male — % | Male — Adj. residual | Female — Freq. | Female — % | Female — Adj. residual | Total — Freq. | Total — % |
|---|---|---|---|---|---|---|---|---|
| 1 | 37 | 2.9% | (2.4) | 8 | 1.2% | (-2.4) | 45 | 2.3% |
| 2 | 166 | 13.2% | (0.7) | 80 | 12.0% | (-0.7) | 246 | 12.8% |
| 3 | 130 | 10.3% | (-1.0) | 78 | 11.7% | (1.0) | 208 | 10.8% |
| 4 | 412 | 32.6% | (3.1) | 172 | 25.9% | (-3.1) | 584 | 30.3% |
| 5 | 67 | 5.3% | (-2.8) | 57 | 8.6% | (2.8) | 124 | 6.4% |
| 6 | 104 | 8.2% | (-1.1) | 65 | 9.8% | (1.1) | 169 | 8.8% |
| 7 | 9 | 0.7% | (-0.8) | 7 | 1.1% | (0.8) | 16 | 0.8% |
| 8 | 39 | 3.01% | (-2.7) | 37 | 5.6% | (2.7) | 76 | 3.9% |
| 9 | 168 | 13.3% | (-0.8) | 97 | 14.6% | (0.8) | 265 | 13.8% |
| 10 | 40 | 3.2% | (-0.3) | 23 | 3.5% | (0.3) | 63 | 3.3% |
| 11 | 90 | 7.1% | (0.8) | 41 | 6.2% | (-0.8) | 131 | 6.8% |
| Total | 1262 | 100% | 665 | 100% | 1927 | 100% |
Adjusted residuals above 1.96 or below –1.96 correspond to the value of the Normal distribution with more than 95% confidence.
4.4 Frequency of votes by region
Table 6 (below) relates the region of origin indicated by the evaluator to the chosen image. The Chi-square test showed a significant association, χ²(40,1) = 75.226 (p<0.001). As the table shows, the North region is associated with Image 1 and Image 8. In the Southeast region there was a greater preference for Image 3 relative to the other regions, the South region for Image 6, and the Midwest for Image 1. This does not mean that the most-voted images in these regions were those highlighted above, only that these images had a higher frequency when compared with the other regions. Thus, Image 4 and Image 9 were the most chosen for all regions, as Graph 9, below, illustrates.

Table 6 – Distribution of vote frequency by region
| Image | North | Northeast | Southeast | South | Midwest | Total |
|---|---|---|---|---|---|---|
| 1 | 3 (11.1%, 3.5) | 3 (1.7%, -0.2) | 14 (1.2%, -2.8) | 10 (2.0%, 0.2) | 8 (7.5%, 4.3) | 38 (1.9%) |
| 2 | 2 (7.4%, -0.8) | 28 (15.9%, 1.3) | 143 (12.3%, -0.8) | 65 (13.3%, 0.4) | 13 (12.3%, -0.2) | 251 (12.8%) |
| 3 | 2 (7.4%, -0.6) | 21 (11.9%, 0.5) | 148 (12.7%, 3.2) | 36 (7.4%, -2.9) | 6 (5.7%, -1.8) | 213 (10.9%) |
| 4 | 8 (29.6%, -0.1) | 45 (25.6%, -1.6) | 367 (31.6%, 0.9) | 145 (29.7%, -0.6) | 39 (36.8%, 1.4) | 604 (30.8%) |
| 5 | 1 (3.7%, -0.6) | 13 (7.4%, 0.6) | 72 (6.2%, -0.4) | 32 (6.6%, 0.2) | 7 (6.6%, 0.1) | 125 (6.4%) |
| 6 | 1 (3.7%, -0.9) | 17 (9.7%, 0.5) | 92 (7.9%, -1.5) | 54 (11.1%, 2.1) | 7 (6.6%, -0.8) | 171 (8.7%) |
| 7 | 0 (0.0%, -0.5) | 0 (0.0%, -1.3) | 9 (0.8%, -0.3) | 0 (0.0%, 0.6) | 2 (1.9%, 1.3) | 16 (0.8%) |
| 8 | 3 (11.1%, 2.0) | 6 (3.4%, -0.3) | 43 (3.7%, -0.2) | 19 (3.9%, 0.2) | 3 (2.8%, -0.5) | 74 (3.8%) |
| 9 | 5 (18.5%, 0.7) | 20 (11.4%, -1.0) | 159 (13.7%, -0.3) | 74 (15.2%, 0.9) | 14 (13.2%, -0.2) | 272 (13.9%) |
| 10 | 1 (3.7%, 0.1) | 5 (2.8%, -0.3) | 40 (3.4%, 0.7) | 12 (2.5%, -1.1) | 5 (4.7%, 0.9) | 63 (3.2%) |
| 11 | 1 (3.7%, -0.6) | 18 (10.2%, 1.9) | 75 (6.5%, -0.6) | 36 (7.4%, 0.6) | 2 (1.9%, -2.0) | 132 (6.7%) |
| Total | 27 (100%) | 176 (100%) | 1162 (100%) | 488 (100%) | 106 (100%) | 1959 (100%) |
Each cell shows: frequency (percentage, adjusted residual). Adjusted residuals above 1.96 or below –1.96 correspond to the value of the Normal distribution with more than 95% confidence.
4.5 Frequency of votes according to occupation
For the occupation variable, the Chi-square test result χ²(50,1) = 83.169 (p<0.001) indicated a significant difference in choices depending on the voter's profession. According to Table 7 (below), plastic surgeons assigned a higher number of votes to Image 1 and Image 7 than individuals belonging to the other professions. Other associations stood out, such as: Exact Sciences with a higher frequency for Image 4 relative to the others, and Social Sciences and Others for Image 11. Graph 10 illustrates the vote frequency by occupation.

Table 7 – Distribution of vote frequency by occupation
| Image | Dentistry | Plastic Surgery | Health Sciences | Arts | Exact Sciences | Social Sciences and Others | Total |
|---|---|---|---|---|---|---|---|
| 1 | 0 (0.0%, -1.1) | 2 (13.3%, 5.3) | 1 (0.8%, 0.0) | 0 (0.0%, -0.7) | 5 (1.0%, 0.4) | 6 (0.7%, -0.5) | 14 (0.9%) |
| 2 | 20 (14.3%, 0.4) | 3 (20.0%, 0.8) | 19 (15.7%, 0.8) | 11 (20.4%, 1.6) | 55 (10.9%, -1.9) | 110 (13.7%, 0.4) | 218 (13.3%) |
| 3 | 16 (11.4%, 0.3) | 1 (6.7%, -0.5) | 17 (14%, 1.2) | 5 (9.3%, -0.4) | 51 (10.1%, -0.6) | 87 (10.8%, 0.0) | 177 (10.8%) |
| 4 | 38 (27.1%, -1.0) | 4 (26.7%, -0.4) | 32 (26.4%, -1.1) | 16 (29.6%, -0.2) | 185 (36.6%, 3.3) | 232 (28.8%, -1.8) | 507 (30.9%) |
| 5 | 12 (8.6%, 1.0) | 0 (0.0%, -1.0) | 9 (7.4%, 0.4) | 6 (11.1%, 1.4) | 35 (6.9%, 0.4) | 46 (5.7%, -1.4) | 108 (6.6%) |
| 6 | 12 (8.6%, -0.1) | 2 (13.3%, 0.6) | 11 (9.1%, 0.1) | 4 (7.4%, -0.4) | 37 (7.3%, -1.4) | 78 (9.7%, 1.3) | 144 (8.8%) |
| 7 | 0 (0.0%, -1.1) | 1 (6.7%, 2.7) | 2 (1.7%, 1.2) | 1 (1.9%, 1.0) | 3 (0.6%, -0.4) | 5 (0.6%, -0.5) | 12 (0.7%) |
| 8 | 6 (4.3%, 0.3) | 0 (0.0%, -0.8) | 3 (2.5%, -0.8) | 0 (0.0%, -1.5) | 16 (3.2%, -0.9) | 38 (4.7%, 1.8) | 63 (3.8%) |
| 9 | 26 (18.6%, 1.5) | 0 (0.0%, -1.6) | 18 (14.9%, 0.2) | 9 (16.7%, 0.5) | 69 (13.7%, -0.4) | 111 (13.8%, -0.5) | 233 (14.2%) |
| 10 | 5 (3.6%, 0.3) | 1 (6.7%, 0.8) | 4 (3.3%, 0.1) | 2 (3.7%, 0.3) | 14 (2.8%, -0.5) | 25 (3.1%, 0.0) | 51 (3.1%) |
| 11 | 5 (3.6%, -1.6) | 1 (6.7%, 0.0) | 5 (4.1%, -1.2) | 0 (0.0%, -2.0) | 35 (6.9%, 0.0) | 67 (8.3%, 2.2) | 113 (6.9%) |
| Total | 140 (100%) | 15 (100%) | 121 (100%) | 54 (100%) | 505 (100%) | 805 (100%) | 1640 (100%) |
Each cell shows: frequency (percentage, adjusted residual). Adjusted residuals above 1.96 or below –1.96 correspond to the value of the Normal distribution with more than 95% confidence.
4.6 Frequency of votes by ethnicity
The Chi-square test result χ²(20,1) = 31.797 (p<0.05) indicated significant differences at the 5% level. Black evaluators assigned more votes to Images 1 and 11 than the other participants of other races. Graph 11 (below) illustrates the vote frequencies by ethnicity.

Table 8 (following) shows the vote frequencies by ethnicity.
Table 8 – Distribution of vote frequency by ethnicity
| Image | White — Freq. | White — % | White — Adj. res. | Black — Freq. | Black — % | Black — Adj. res. | Other — Freq. | Other — % | Other — Adj. res. | Total |
|---|---|---|---|---|---|---|---|---|---|---|
| 1 | 30 | 1.7% | (-1.5) | 6 | 8.7% | (4.2) | 1 | 0.7% | (-1.2) | 37 (1.9%) |
| 2 | 227 | 13.2% | (0.7) | 9 | 13.0% | (0.0) | 16 | 10.7% | (-0.9) | 252 (13.0%) |
| 3 | 187 | 10.9% | (-0.3) | 8 | 11.6% | (0.2) | 17 | 11.3% | (0.2) | 212 (10.9%) |
| 4 | 532 | 30.9% | (-0.3) | 18 | 26.1% | (-0.9) | 52 | 34.7% | (1.0) | 602 (31.0%) |
| 5 | 106 | 6.2% | (-0.1) | 3 | 4.3% | (-0.6) | 11 | 7.3% | (0.6) | 120 (6.2%) |
| 6 | 150 | 8.7% | (0.2) | 4 | 5.8% | (-0.9) | 14 | 9.3% | (0.3) | 166 (8.7%) |
| 7 | 15 | 0.9% | (-0.1) | 1 | 1.4% | (0.5) | 1 | 0.7% | (-0.3) | 17 (0.9%) |
| 8 | 62 | 3.6% | (-0.7) | 1 | 1.4% | (-1.0) | 9 | 6.0% | (1.5) | 72 (3.7%) |
| 9 | 245 | 14.2% | (0.1) | 9 | 13.0% | (-0.2) | 16 | 10.7% | (-1.2) | 270 (13.9%) |
| 10 | 59 | 3.4% | (0.9) | 1 | 1.4% | (-0.9) | 4 | 2.7% | (-0.4) | 64 (3.3%) |
| 11 | 110 | 6.4% | (-1.0) | 9 | 13.0% | (2.2) | 9 | 6.0% | (-0.3) | 128 (6.6%) |
| Total | 1723 | 100% | 69 | 100% | 150 | 100% | 1942 (100%) |
Adjusted residuals above 1.96 or below –1.96 correspond to the value of the Normal distribution with more than 95% confidence.
4.7 Frequency of votes according to age group
For the age variable, there was no significant association, where χ²(40,1) = 46.351 (p=0.227), i.e., (p>0.10). Some age categories showed a higher frequency than the other groups; however, it was not possible to confirm the significance of this result. Graph 12, below, illustrates the votes received by age group. Table 9 (following) presents the vote frequencies according to age range.

Table 9 – Distribution of vote frequency by age group
| Image | Under 18 | 18–25 | 25–30 | 30–35 | Over 35 | Total |
|---|---|---|---|---|---|---|
| 1 | 0 (0.0%, -0.5) | 2 (0.4%, -1.1) | 6 (1.8%, 2.0) | 4 (1.3%, 0.8) | 5 (0.6%, -1.1) | 17 (0.9%) |
| 2 | 3 (11.5%, -0.2) | 49 (11%, -1.4) | 44 (13.4%, 0.2) | 39 (12.3%, -0.4) | 118 (14.2%, 1.4) | 253 (13.0%) |
| 3 | 0 (0.0%, -1.8) | 41 (9.2%, -1.4) | 44 (13.4%, 1.5) | 36 (11.3%, 2.0) | 94 (11.3%, 0.3) | 215 (11.0%) |
| 4 | 10 (38.5%, 0.8) | 152 (34.2%, 1.6) | 108 (32.8%, 0.7) | 105 (33.0%, 0.8) | 232 (28.0%, -2.6) | 607 (31.2%) |
| 5 | 2 (7.7%, 0.3) | 26 (5.8%, -0.5) | 17 (5.2%, -1.0) | 22 (6.9%, 0.4) | 57 (6.9%, 0.8) | 124 (6.4%) |
| 6 | 1 (3.8%, -0.9) | 50 (11.2%, 2.0) | 17 (5.2%, -2.6) | 21 (6.6%, -1.5) | 83 (10.0%, 1.6) | 172 (8.8%) |
| 7 | 0 (0.0%, -0.5) | 6 (1.3%, 1.4) | 0 (0.0%, -1.8) | 4 (1.3%, 0.9) | 6 (0.7%, -0.4) | 16 (0.8%) |
| 8 | 1 (3.8%, 0.0) | 12 (2.7%, -1.4) | 9 (2.7%, -1.1) | 12 (3.8%, 0.0) | 40 (4.8%, 2.0) | 74 (3.8%) |
| 9 | 5 (19.2%, 0.8) | 58 (13.0%, -0.7) | 49 (14.9%, 0.5) | 46 (14.5%, 0.3) | 115 (13.9%, -0.2) | 273 (14.0%) |
| 10 | 1 (3.8%, 0.2) | 17 (3.8%, 0.7) | 12 (3.6%, 0.4) | 11 (3.5%, 0.2) | 23 (2.8%, -1.1) | 64 (3.3%) |
| 11 | 3 (11.5%, 1.0) | 32 (7.2%, 0.3) | 23 (7.0%, 0.1) | 18 (5.7%, -0.9) | 57 (6.9%, 0.1) | 133 (6.8%) |
| Total | 26 (100%) | 445 (100%) | 329 (100%) | 318 (100%) | 830 (100%) | 1948 (100%) |
Each cell shows: frequency (percentage, adjusted residual). Adjusted residuals above 1.96 or below –1.96 correspond to the value of the Normal distribution with more than 95% confidence.
4.8 Results of the logistic regression analysis
Logistic regression is a statistical technique that seeks to describe the relationships and magnitude between a dependent categorical variable and one or more explanatory variables.
The regression analysis seeks to verify the impact of each variable on individuals' choices; for this, the response variable was considered as Y=1 if the individual chose image i and Y=0 if the individual did not choose image i.
Table 10 – Input data for the estimation of the regression model
| Image | Nasolabial Angle | Labial Angle | Mentolabial Angle | Facial Angle | Total Votes |
|---|---|---|---|---|---|
| 1 | 119º | 104º | 151º | 12º | 46 |
| 2 | 119º | 103º | 152º | 16º | 260 |
| 3 | 121º | 99º | 152º | 16º | 223 |
| 4 | 112º | 105º | 147º | 12º | 614 |
| 5 | 117º | 95º | 148º | 16º | 131 |
| 6 | 117º | 103º | 148º | 13º | 175 |
| 7 | 115º | 101º | 144º | 9º | 17 |
| 8 | 123º | 107º | 150º | 14º | 75 |
| 9 | 117º | 104º | 122º | 14º | 275 |
| 10 | 117º | 104º | 144º | 12º | 69 |
| 11 | 119º | 104º | 143º | 10º | 137 |
Table 11 – Description of the variables used in the logistic regression
| Response Variable | Explanatory Variables |
|---|---|
| Y=1 if the individual chose the image | X1: Nasolabial Angle |
| X2: Labial Angle | |
| X3: Mentolabial Angle | |
| Y=0 if the individual did not choose the image | X4: Facial Angle |
In logistic regression, the relationships between the response variable and the explanatory variable are described through a probability function of the response Y=1 or Y=0. When Y takes the value 1, it indicates the presence of the characteristic of interest, and Y=0 indicates the absence of the characteristic of interest. For each category of X, the objective is to calculate the proportion of times Y takes the value 1. The model describes how the proportion of successes (Y=1) is influenced by the explanatory variables. The expected proportion of successes (Y=1) is denoted π = E(Y). π also represents the probability that a randomly chosen individual possesses the characteristic of interest, based on the model's explanatory variables. The model is given by equation 1.1 (SPSS, 1993).
log(π / (1−π)) = β₀ + β₁X₁ + ... + βₖXₖ (equation 1.1)
where the ratio π/(1−π) is called the odds ratio, representing how many times more likely success is than failure. The logarithm of the odds ratio is called the logistic transformation, or, in short, the logit.
Thus, the logistic regression model for K explanatory variables is given by:
logit(π) = β₀ + β₁X₁ + β₂X₂ + β₃X₃ + .... + βₖXₖ (equation 1.2)
where:
π represents the probability that a randomly chosen individual gives the expected response β₀ is the model constant βᵢ is the partial regression coefficient of explanatory variable i.
A non-significant value of βᵢ (p>0.10) establishes that Xᵢ has no effect on the probability π, that is, Xᵢ does not influence the probability of occurrence of Y.
For this study, the variables considered appear in Table 10, above.
Table 12 – Results of the logistic regression
| β | S.E. | Wald | df | Sig. | Exp(β) | |
|---|---|---|---|---|---|---|
| Nasolabial Angle | -0.258 | 0.009 | 753.037 | 1 | 0.000 | 0.772 |
| Labial Angle | 0.116 | 0.010 | 140.794 | 1 | 0.000 | 1.122 |
| Mentolabial Angle | 0.105 | 0.009 | 126.364 | 1 | 0.000 | 1.111 |
| Facial Angle | 0.205 | 0.015 | 177.622 | 1 | 0.000 | 1.227 |
| Constant | -2.118 | 1.714 | 1.526 | 1 | 0.217 | 0.120 |
In the logistic model, the coefficients are interpreted as the change occurring in the log-odds due to a one-unit change in the independent or explanatory variable.
For this study, it is estimated that the change in the Nasolabial angle most strongly affected the individual's choice of image. The β value associated with variable X1: Nasolabial has a negative sign, indicating that an increase in the nasolabial angle would tend to decrease the individual's chance of choosing the image.
Positive β values indicate that the probability of the event occurring increases as the value of the explanatory variable X increases. Negative values indicate the opposite. The larger the value of β (in absolute terms), the more rapidly the values of π grow, approaching 1.
Following this reasoning, the positive coefficients for the Labial angle, Mentolabial angle, and Facial angle indicate that an increase of one unit in these variables tends to increase individuals' probability of choice. This conclusion is limited to the levels tested, described in Table 10, above.
The odds-ratio value is presented in the Exp(β) column. For an increased Nasolabial angle, the individual is expected to be 0.772 times less likely to choose the image, and for an increased Labial angle, the individual is expected to be 1.227 times more likely to choose the image.
This information was obtained on data from the images used in the present investigation, this test having been run within the domain of the explanatory variables considered, as per Table 10, above. Nevertheless, some indications, based on the results of individual preference, pointed to preferred levels among the possibilities offered in the experiment. The results are listed in Table 13.
Table 13 – Levels of the explanatory variables with the highest choice frequency
| Variable | Suggested measurement* |
|---|---|
| Nasolabial Angle | 112º |
| Mentolabial Angle | 147º |
| Labial Angle | 107º |
| Facial Angle | 12º |
Approximate values.
5 DISCUSSION
Through the statistical analysis described in the previous chapter, it was confirmed that the most-voted images do in fact represent the evaluators' preference, among the options offered (p<0.001). A similar finding was obtained by UDRY (1965), who carried out a study of population preference in which he obtained responses from a newspaper advertisement, concluding that there was significant agreement in the responses regarding the "most beautiful" face.
Respondents showed significant consistency in determining the most preferred images, which agrees with the findings of RIEDEL (1957), PRAHL-ANDERSON et al. (1979), HSU (1999), MEJIA-MAIDL and EVANS (2000), among others, who concluded that significant differences existed in the preference of the evaluators interviewed in their studies. A different result was reported by MOORE (1969), who states that there is no consensus in determining facial esthetics, and that what is esthetically pleasing to some is not pleasing to others.
From the analysis of the votes received, it was possible to determine, using the Chi-square test, the most preferred images. Through Logistic Regression, it was determined which values for the measurements analyzed produced these choices.
5.1 Analysis of preference associated with the groups studied
The results obtained in the present investigation indicated significant differences in evaluators' preference when the different categories were compared, with the exception of the "age group" category (p=0.227). No significant association was detected between preferred image and age group.
The results obtained in this study differ from those found by FORD, PROTHRO, and CHILD (1966), as well as those of CHILD and IWAO (1968), who carried out comparisons between esthetic evaluation criteria across different categories of evaluators. Those researchers concluded that the people interviewed used the same esthetic evaluation criteria regardless of nationality, age, sex, or occupation.
The results of the present investigation also differ from what was found by ILIFFE (1960), where the responses of 4,300 evaluators were analyzed and tabulated by age, sex, and occupation of the voters. ILIFFE concluded that the members of his sample had a common basis for evaluating facial esthetics, with no significant differences between the preferences of the various categories analyzed. This difference from the present study may be related to the composition of that author's sample, obtained through a London newspaper advertisement, without quality control over the data that this type of collection can present.
5.1.2 Opinion of male and female evaluators (p<0.001)
The results of this experiment agree with what was found by HIER et al. (1999), whose results indicated differences between sexes, with women preferring more protruded lips than men.
KITAY et al. (1999), however, did not find any significant difference regarding the votes of male or female evaluators in selecting the most pleasing profile among the available options. This difference may be explained by the small number of evaluators.
5.1.3 Opinion of evaluators by region of the country (p<0.001)
The results obtained in this experiment agreed with those of MEJIA-MAIDL and EVANS (2000), who found that geographic location influences evaluators' concept of beauty.
5.1.4 Opinion of evaluators from different occupations (p<0.001)
The results of the comparison of preference between laypeople and dental surgeons confirm the observations of RIEDEL (1957). This author states that the lay public presents a consistent and demonstrable concept of facial esthetic preference. In the present study, the lay public — not directly linked to studies of facial esthetics — showed greater consistency in their choices when compared to dental professionals. This statement may be explained by the intuitive choice of the lay participants, different from the choice made by professionals, who perhaps sought measurements and logical explanations for their decisions. PECK and PECK (1970) comment that the lay public's concept of facial esthetics is developed from external observations. They further state that a person can decide almost instantly whether a face seems pleasing to them or not, through an unstructured, subconscious decision. With results similar to those of this experiment, HIER et al. (1999) found that, in their study, laypeople showed a preference for more protruded lips than dental professionals. Similar to these results were those of BOWMAN and JOHNSTON (2000), who, comparing the opinions of 58 laypeople and 42 dentists, noticed in their analysis of the results that laypeople appeared less critical than dentists regarding facial esthetics.
The present result also agrees with the findings of PRAHL-ANDERSON et al. (1979), who evaluated differences in the esthetic preference of laypeople and orthodontists. Using facial profile lines that were subjectively evaluated by 1,150 parents, 72 dental surgeons, and 54 orthodontists, they concluded there were significant differences in the evaluation by laypeople and professionals in 10 of the 11 profiles presented. Likewise, CZARNECKI, NANDA, and CURRIER (1993) found statistically significant differences when comparing the esthetic preference of dental professionals and laypeople, similar to that obtained in this experiment. The results of the present study are also similar to those of SCOTT and JOHNSTON Jr. (1999), who carried out a comparative study on lay and orthodontist evaluators. Their conclusions indicated that there is an important interaction between occupation and the observer's preference.
COX and VAN DER LINDEN (1971) used in their sample the opinions of 10 dental surgeons and 10 laypeople. Different from the results obtained in the present study, those authors found no significant differences in the preference of dentists and laypeople for facial profiles. The justification for such a difference may be found in the small sample used in that study. Likewise, NOMURA et al. (1999) found no significant differences in the opinion of orthodontists and students. However, in their sample, the evaluators who represented the lay segment were dental students, and may have been influenced by experience or environment in their decisions.
The differences in preference found among the various occupations reported by the evaluators can be explained by the different evaluation criteria used. The experience of dental professionals may have led to a choice using prior measurements and experience, while evaluators not linked to dentistry probably selected the image through a subconscious, intuitive decision, thus demonstrating greater consistency in their opinion. This difference could explain the low consistency of dental professionals compared to the great consistency observed in laypeople's choices.
5.1.5 Differences in preference by ethnic origin (p<0.05)
In the present study, significant differences were found in the preference between evaluators of different ethnic origins, agreeing with the results obtained by FARROW, ZARRINIA, and AZIZI (1993). These authors observed that Black Americans had a preference for straighter profiles, in contrast to what was considered normal for their race at the time, but which did not match the profile characteristic of the white race. OKUYAMA and MARTINS (1997) also found differences between evaluators of different ethnicities, observing in their study that there was a preference among Black evaluators for profiles with mild facial convexity. Similar results were found by SCOTT and JOHNSTON Jr (1999), whose results indicated an important interaction between race and evaluator preference.
The results of the present investigation, however, differ from those of MARTIN (1964), who found no significant differences in preference between evaluators of different ethnic origins residing in the same country.
5.1.6 Differences in preference by age group (p=0.227)
The present study found no significant differences in the preference of the various age groups investigated. This result is similar to that of UDRY (1965), who states he did not find differences in evaluators' preference when the votes were analyzed by age group.
5.2 Analysis of preference associated with the angles studied
5.2.1 Nasolabial Angle (p=0.000)
The Nasolabial angle preferred by the majority of evaluators, confirmed by the logistic regression test, was 112 degrees (p=0.000). This finding agrees with the results obtained by HALL et al. (2000), of 113 degrees, found as the value of greatest preference for the Nasolabial angle. A similar value was found by NANDA et al. (1990), where adult female patients presented 110.7º ±10.9º for this angle. Likewise, the value obtained falls within the limits established by FITZGERALD, NANDA, and CURRIER (1992), in a study evaluating the nasolabial angle of 104 adults of both sexes, in which they concluded that the mean value for this angle was 114° ± 10°. The authors further report that no significant differences were found in this angle between the men and women in the sample.
The results present some difference, still within one standard deviation, from that indicated by BURSTONE in 1958 for the Nasolabial angle, which averaged 118° in the women of his sample. This difference may be related to the author's selection method, where the 40 members of his sample were selected without randomization and by the author's own taste, thus reflecting characteristics of his preference. A similar difference was found when comparing the results of BERTHOLD (1998), who describes a value of 109.29 degrees and a standard deviation of 8.32.
Compared to the result obtained by NANDA, GHOSH, and BAZAKIDOU (1996), of 102.78º and a standard deviation of 14.01, the results obtained in the present study would still fall within the stipulated standard deviation. However, it is believed that such differences are explained by the large variation in the inclination of the nasal columella presented by the population, affecting the amplitude of the angle without representing a real change in the inclination of the upper lip, and this statement justifies the large standard deviations found by the authors cited above. Additionally, the procedure used to obtain the Nasolabial angle, using either the tangent-lines method or the anatomical-points method (HWANG, KIM, and McNAMARA Jr, 2000), associated with different methodologies for marking Subnasale described by FITZGERALD, NANDA, and CURRIER (1992), justify some differences in the results obtained for this angle among different authors.
5.2.2 Mentolabial Angle (p=0.000)
The value obtained in this experiment was 147º for the Mentolabial angle (p=0.000) and differs from that reported by NANDA, GHOSH, and BAZAKIDOU (1996), who found in their sample a value of 128.79º, with a standard deviation of 13.42. A difference was found when the value obtained was compared to the result of FITZGERALD, NANDA, and CURRIER (1992), of 127.1º. One justification for such differences may lie in the use of the "anatomical-points method" in determining the lines that make up these angles. The cited authors, although not stating the method used, may have used the tangent-lines method, causing a similar difference in the values, as demonstrated by HWANG, KIM, and McNAMARA Jr (2000). The tendency toward preference for more protruded lips, reported by PECK and PECK (1970) and AUGER and TURLEY (1999), may explain the values above those expected for the Mentolabial angle.
5.2.3 Labial Angle (p=0.000)
This measurement, as conceived for the present investigation, has no equivalent described in the literature, precluding specific comparisons. Its validity may be confirmed through its use in future studies, since the value obtained, 107º, was statistically significant (p=0.000). The logistic regression analysis indicated that increments in this angle increased the chances of the profiles being selected. PECK and PECK (1970), analyzing classical-period Greek works of art, state that the lips frequently appear slightly parted, suggesting movement. It is speculated that, in modern art photography, one frequently perceives that the lips are slightly parted, suggesting sensuality. In addition, the trend found by AUGER and TURLEY (1999), and by CZARNECKI, NANDA, and CURRIER (1993), of preference for more protruded lips, may be related to this finding of preference for an increased labial angle, since these measurements — lip projection and labial angle — change proportionally to one another. It is further believed that, since the labial angle — as conceived in this investigation — uses points LS and LI instead of the internal tangents of the lips, it may represent a greater amount of apparent lip vermilion, an aspect preferred by the modern population, according to the study by AUGER and TURLEY (1999). This preference for anteriorly positioned lips and a greater amount of apparent lip is also confirmed by SKINAZI, LINDAUER, and ISAACSON (1994) and is observed in the plastic surgery literature, with an increase in case reports of lip augmentation, according to ALKEK (1991).
The preference for higher values for the Labial angle, as described in this experiment, may reflect a tendency toward slightly more projected lips, or a greater amount of apparent labial tissue. This lip projection could be related to the perception of age, with fuller lips appearing more youthful, AUGER and TURLEY (1999).
5.2.4 Facial Angle (p=0.000)
The result obtained through logistic regression for the Facial angle was 12º (p=0.000), the same value prescribed by the LEGAN and BURSTONE (1980) norm, and found as the value of greatest preference for the facial convexity angle by HALL et al. (2000). A similar result was reported by BERTHOLD (1998), obtaining 12.14º with a standard deviation of 3.15 degrees, for the female facial convexity angle. The result was close to that recommended by BURSTONE (1958), which in his sample of 40 young white adults was 11.3°, for women.
The value is close to the results of NANDA, GHOSH, and BAZAKIDOU (1996), who found in their sample a value for the Facial angle of 14.26º, with a standard deviation of 4.29 degrees. COX and VAN DER LINDEN (1971) found a value of 16.2º. These slightly higher values, however, may be explained by the fact that these authors used the soft-tissue Nasion point as the origin instead of the soft-tissue Glabella, to obtain the facial convexity angle.
The effect of changes in the Facial angle on evaluator preference was smaller than the effect caused by alterations in the Nasolabial and Mentolabial angles, similar to what was found by AUGER and TURLEY (1999), who found no significant differences for this angle when analyzing its influence on observer preference.
5.3 Other considerations
NANDA and GHOSH (1980) believe that people's appearance is the result of shapes combined with the influence of their personality traits. It is thus believed to be essential that, in studies evaluating facial esthetics, the personality characteristics of the bearers of the faces used as models not be perceptible to the evaluators.
With regard to the objective of measuring the facial characteristics that influence the preference of the members of the present sample, one can consider the findings of FARKAS and KOLAR (1987), who state that facial attractiveness is not an abstract concept, but a quantitatively well-defined anatomical quality.
With regard to the fact that the present study focused on the lower third of the face, one can cite FARKAS and KOLAR (1987), who concluded that the measurements of the middle and upper thirds of the face are relatively constant when evaluated from an esthetic point of view. Likewise, AUGER and TURLEY (1999) found no significant differences for the measurements calculated above Subnasale.
With regard to the magnitude of the changes used in the present research instrument, one can consider the study by ROMANI et al. (1993), who used evaluations made by 22 dental surgeons and 22 laypeople to determine their level of sensitivity to changes and their esthetic preferences. They concluded that both laypeople and dental surgeons were able to detect even subtle changes in the facial profile, close to one millimeter.
Regarding the use of digital images for the present study, the suggestion of ROMANI et al. (1993) was considered appropriate, citing that after the use of facial drawings, paper cutouts, wooden models, darkened photographs, and silhouettes, the orthodontist can nowadays make use of digital image processors for studies of esthetic preference.
Harmony, balance, and proportionality are important considerations in studies of facial esthetics, according to HSU (1993). This author suggests that, in evaluating the harmony and balance of the facial profile, the relationship between nose, lips, and chin should be included. The present investigation, however, considered that these properties are a reflection of interactions among the different measurements obtained, thus requiring further research to evaluate their proportions.
With regard to the possibility of applying the findings to evaluations made on male faces, it is considered prudent to carry out new studies using a similar methodology, but with images corresponding to the male sex. Even though authors such as KITAY et al. (1999) did not find statistically significant differences between the male and female profile considered most pleasing in their study, it is considered that the results obtained through the present instrument reflect solely characteristics of the female facial profile, being limited to the options offered in the eleven images.
Regarding the initial photograph used, and the direction and magnitude of the options offered to the evaluators, one can cite SPYROPOULOS and HALAZONETIS (2001), who, with the aim of evaluating the relative importance of the facial profile in facial attractiveness, made alterations to digitized photographs of 20 female patients. The resulting average profiles received hair from the original photographs and, once printed, were submitted for evaluation by 10 laypeople and 10 orthodontists, together with the initial photographs. The profiles created digitally, representing the average of the facial characteristics, received the highest scores. Thus, it can be attested that, given the existence of several options with oscillations more and less in the characteristics of a facial profile, evaluators would be induced to vote for the average, which HIER et al. (1999) refer to as the mean-induction bias. The pursuit of the mean is a natural tendency of living beings, according to DARWIN (1920).
The success estimate considered was to obtain responses to 49% of the requests. The response rate was 51.2%, similar to that found in research with similar methodology, such as that of COUPER, BLAIR, and TRIPPLET (1999), SCHAEFFER and DILLMAN (1998), and SHEEHAN and HOY (1999).
The response speed was similar to that found by COUPER, TRAUGOTT, and LAMIAS (2001) and by COMLEY (1997), as well as TERHANIAN (1999), where one of the greatest advantages of this type of research was noted. The 2,041 opinions were received within nine days.
According to DILLMAN et al. (1998), one can expect that visual elements such as those used complement or support the research instrument, its efficiency, and the quality of its data.
Since the responses were selected directly by the evaluator, the need for contact between the interviewer and the respondents was eliminated, as noted by SCHILLEWAERT, LANGERAK, and DUHAMEL (1998). Thus, the questionnaire responses did not present errors induced by an interviewer, as reported by McCULLOUGH (1998). Likewise, the absence of an interviewer decreases the possibility of the bias that an interviewer brings to research. McCULLOUGH (1998) further reports that the interviewer's state of mind, intentions, or opinions will not be reflected in the data, since there is no intervention by an interviewer.
Since the responses were transmitted automatically from the questionnaire to the statistical analysis program, there was no human interaction in the validation and transfer of the data, minimizing the possibility of imprecision in this process, which was confirmed by McCULLOUGH (1998). Likewise, this automation ensured that the identity of the evaluators was not exposed at any stage of the experiment.
6 CONCLUSION
Through this experiment it can be concluded that the groups studied showed consistent criteria for evaluating the esthetics of the facial profiles presented in the eleven images.
When the cephalometric values of the images chosen by the evaluators were compared to standard values associated with each measurement, the following conclusion became evident: the majority of evaluators, among the options offered, preferred the images that presented a Nasolabial angle of 112 degrees, a Mentolabial angle of 147 degrees, a Labial angle of 107 degrees, and a Facial angle of 12 degrees.
This study also allowed the conclusion that there are differences of opinion among evaluators when the associations between the evaluator's esthetic preference and their sex are analyzed. A significant association was also found between the preferred images and the evaluator's region of the country, as well as their ethnicity and occupation.
The images with the highest vote frequency were those that presented: vertical decrease of the lower third of the face (30.4% of votes), projection of the upper lip and lower lip (13.6% of votes), the image with no alterations (12.9% of votes), and the image with retrusion of the lower lip and chin (11.0% of votes).
7 REFERENCES
Note: the works cited below are, in their great majority, papers originally published in English in international journals; their titles are reproduced as originally published. The handful of sources originally published in Portuguese are marked "[in Portuguese]". Bibliographic abbreviations have been normalized to English convention (vol., no., pp., month names).
ADCOCK, C. J. Aesthetics. Journal of General Psychology, vol. 67, no. 1, pp. 83-89, Jan. 1962. ISSN: 0022-1309.
ALKEK, D. S. Lip augmentation with silicone. Journal of Dermatological and Surgical Oncology, vol. 17, no. 9, pp. 747-748, Sep. 1991. ISSN: 0148-0812.
ANDERSON, N. K.; EVANS, C. A.; GIDDON, D. B. Comparison of perceptions of computer-animated left- and right-facing profiles. Journal of Prosthodontics, vol. 8, no. 2, pp. 72-79, June 1999. ISSN: 1059-941X.
ANGELO, S. J.; CITKOWITZ, E. An electronic survey of physicians using on-line clinical discussion groups: a brief report. Connecticut Medicine, vol. 65, no. 3, pp. 135-139, Mar. 2001. ISSN: 0010-6178.
ANGLE, E. H. The treatment of malocclusion of the teeth. Philadelphia, S. S. White Co., 7th ed., 1907.
ANGLE, E. H. Treatment of malocclusion of the teeth and fractures of the maxillae. Philadelphia, S. S. White Co., 6th ed., 1900. pp. 15-23.
ARNETT, G. W.; BERGMAN, R. T. Facial keys to orthodontic diagnosis and treatment planning. Part I. American Journal of Orthodontics and Dentofacial Orthopedics, vol. 103, no. 4, pp. 299-312, Apr. 1993. ISSN: 0889-5406.
ARNETT, G. W.; BERGMAN, R. T. Facial keys to orthodontic diagnosis and treatment planning. Part II. American Journal of Orthodontics and Dentofacial Orthopedics, vol. 103, no. 5, pp. 395-411, May 1993. ISSN: 0889-5406.
AUGER, T. A.; TURLEY, P. K. The female soft tissue profile as presented in fashion magazines during the 1900s: a photographic analysis. International Journal of Adult Orthodontics and Orthognathic Surgery, vol. 14, no. 1, pp. 7-17, Jan. 1999. ISSN: 0742-1931.
BARTLEY, S. H. Principles of perception. New York, Harper and Row, 1958.
BASS, N. M. The aesthetic analysis of the face. European Journal of Orthodontics, vol. 13, no. 5, pp. 343-350, Oct. 1991. ISSN: 0141-5387.
BHATIA, S. N.; LEIGHTON, B. C. A manual of facial growth. Oxford University Press, 1993. pp. 10-15.
BAX, C. The beauty of women. London, F. Muller, 1946. pp. 44-46.
BEARDSLEY, M. C. Aesthetics from classical Greece to the present. New York, Macmillan, 1966. p. 43.
BELL, R. et al. Perception of facial profile and their influence on the decision to undergo orthognathic surgery. American Journal of Orthodontics, vol. 88, no. 4, pp. 323-332, Oct. 1985. ISSN: 0002-9416.
BERTHOLD, T. B. Estudo cefalométrico de perfis faciais agradáveis [in Portuguese; "Cephalometric study of pleasing facial profiles"]. 1998. 155 f. Master's thesis (Master of Science in Dentistry) — School of Dentistry, PUCRS, Porto Alegre, 1998.
BETTS, N. J. Discussion: nasal profile changes after maxillary impaction and advancement surgery. Journal of Oral and Maxillofacial Surgery, vol. 58, no. 1, pp. 475-476, Jan. 2000. ISSN: 0278-2391.
BISHARA, S. E.; HESSION, T. J.; PETERSON, L. C. Longitudinal soft-tissue profile changes: a study of three analyses. American Journal of Orthodontics, vol. 88, no. 3, pp. 209-223, Sep. 1985. ISSN: 0002-9416.
BISHARA, S. E.; JAKOBSEN, J. R.; HESSION, T. J. et al. Soft tissue profile changes from 5 to 45 years of age. American Journal of Orthodontics and Dentofacial Orthopedics, vol. 114, no. 6, pp. 698-706, Dec. 1998. ISSN: 0889-5406.
BLIVEN, B. D.; KAUFMAN, S. E.; SPERTUS, J. A. Electronic collection of health-related quality of life data: validity, time benefits, and patient preference. Quality of Life Research, vol. 10, no. 1, pp. 15-22, Jan. 2001. ISSN: 0962-9343.
BORMAN, H.; OZGUR, F.; GURSU, G. Evaluation of soft-tissue morphology of the face in 1050 young adults. Annals of Plastic Surgery, vol. 42, no. 3, pp. 280-288, Mar. 1999. ISSN: 0148-7043.
BOWMAN, S. J.; JOHNSTON Jr, L. E. The esthetic impact of extraction and nonextraction treatments on caucasian patients. The Angle Orthodontist, vol. 70, no. 1, pp. 3-10, Feb. 2000. ISSN: 0003-3219.
BRADLEY, N. Sampling for Internet surveys. An examination of respondent selection for Internet research. Journal of the Market Research Society, London, vol. 41, no. 4, pp. 387-395, Oct. 1999. ISSN: 0025-3618.
BROADBENT, B. H. A new x-ray technique and its application to orthodontia. The Angle Orthodontist, vol. 1, no. 1, p. 45, Jan. 1931. ISSN: 0003-3219.
BURSTONE, C. J. The integumental profile. American Journal of Orthodontics, vol. 1, no. 44, pp. 1-25, Oct. 1958. ISSN: 0002-9416.
BURSTONE, C. J. Integumental contour and extension patterns. The Angle Orthodontist, vol. 2, no. 29, pp. 93-104, Sep. 1959. ISSN: 0003-3219.
BURSTONE, C. J. Lip posture and its significance in treatment planning. American Journal of Orthodontics, vol. 53, no. 4, pp. 262-284, Apr. 1967. ISSN: 0002-9416.
CARPENTER, R. The esthetic basis of greek art. Bloomington, Indiana University Press, 1959. pp. 92-93.
CARREA, J. U. Les radiofacies à profil délinée en orthodontométrie. La Semaine Dentaire, vol. 6, 1924. pp. 412-419.
CASE, C. S. Some principles governing the development of facial contours in the practice of orthodontia. Columbia Dental Congress, no. 2, p. 727, 1893.
CASE, C. S. The development of esthetic facial contours. In: KIRK, E. C., ed. The American Text-book of Operative Dentistry. Philadelphia, Lea Brothers and Co., 1905. pp. 849-885.
CHACONAS, S. J. Orthodontics. PSG Publishing Company, 1980. pp. 37-45.
CHEN, L. H.; CHEN, W. H. Three-dimensional computer assisted simulation combining facial skeleton with facial morphology for orthognathic surgery. International Journal of Adult Orthodontics and Orthognathic Surgery, vol. 14, no. 2, pp. 140-145, Feb. 1999. ISSN: 0742-1931.
CHILD, I. L.; IWAO, S. Personality and esthetic sensitivity: extension of findings to younger age and to different culture. Journal of Personality and Social Psychology, vol. 8, no. 3, pp. 308-312, Mar. 1968. ISSN: 0022-3514.
CHUNMANEECHOTE, P.; FRIEDE, H. Mandibular setback osteotomy: facial soft tissue behavior and possibility to improve the accuracy of the soft tissue profile prediction with the use of a computerized cephalometric program. (Quick Ceph Image Pro v 2.5). Clinical Orthodontics and Research, vol. 2, no. 2, pp. 85-98, May 1999. ISSN: 1397-5927.
CLAMAN, L.; PATTON, D.; RASHID, R. Standardized portrait photography for dental patients. American Journal of Orthodontics and Dentofacial Orthopedics, vol. 98, no. 3, pp. 197-205, Sep. 1990. ISSN: 0889-5406.
COMLEY, P. The use of the Internet as a data collection tool. Paper presented at the ESOMAR annual conference, Edinburgh, Scotland, n.d.
COUPER, M. P.; BLAIR, J.; TRIPPLET, T. A comparison of mail and e-mail for a survey of employees in federal statistical agencies. Journal of Official Statistics, vol. 15, no. 1, pp. 39-56, Jan. 1999. ISSN: 0282-423X.
COUPER, M. P. Web surveys: a review of issues and approaches. Public Opinion Quarterly, Chicago, vol. 64, no. 4, pp. 464-494, Winter 2000. ISSN: 0033-362X.
COUPER, M. P.; TRAUGOTT, M. W.; LAMIAS, M. J. Web survey design and administration. Public Opinion Quarterly, Chicago, vol. 65, no. 2, pp. 230-253, Summer 2001. ISSN: 0033-362X.
COX, N. H.; VAN DER LINDEN, F. Facial harmony. American Journal of Orthodontics, vol. 60, no. 2, pp. 175-183, Aug. 1971. ISSN: 0002-9416.
CZARNECKI, S. T.; NANDA, R. S.; CURRIER, G. F. Perceptions of a balanced facial profile. American Journal of Orthodontics and Dentofacial Orthopedics, vol. 104, no. 2, pp. 180-187, Aug. 1993. ISSN: 0889-5406.
DA VINCI, L. Proportions of the head, circa 1488-9. Available at: http://banzai.msi.umn.edu/leonardo/. Accessed: Aug. 20, 2001.
DARWIN, C. R. On the Origin of Species [Portuguese edition, "A Origem das Espécies," consulted]. Porto, 1920. 477 pp.
DILLMAN, D. A. et al. Influence of plain versus fancy design on response rates for Web surveys. Paper presented at the Joint Statistical Meetings of the American Statistical Association, Dallas, 1998.
DOWNS, W. B. Analysis of the dentofacial profile. The Angle Orthodontist, vol. 26, no. 4, pp. 191-212, Oct. 1956. ISSN: 0003-3219.
DÜRER, A. De symmetria partium in rectis formis humanorum corporum libri. Nuremberg, 1528. Available at: http://www-groups.dcs.st-and.ac.uk/~history/Mathematicians/Durer.html. Accessed: Aug. 26, 2001.
ETTER, J. F.; PERNEGER, T. V. A comparison of cigarette smokers recruited through the Internet or by mail. International Journal of Epidemiology, vol. 30, no. 3, pp. 521-525, June 2001. ISSN: 0300-5771.
FANIBUNDA, K. B.; THOMAS, P. R. Digital imaging in the assessment of facial deformity. British Journal of Oral and Maxillofacial Surgery, vol. 37, no. 2, pp. 94-98, Apr. 1999. ISSN: 0266-4356.
FARKAS, L. G. Anthropometry of the head and face in medicine. Elsevier North Holland, Inc., 1981. pp. 9-14.
FARKAS, L. G. et al. Anthropomorphic proportions in the upper lip lower lip chin area of the lower face in young white adults. American Journal of Orthodontics, vol. 86, no. 1, pp. 52-60, July 1984. ISSN: 0002-9416.
FARKAS, L. G. et al. Vertical and horizontal proportions of the face in young adult North American Caucasians: revision of neoclassical canons. Plastic and Reconstructive Surgery, vol. 75, no. 3, pp. 328-338, Mar. 1985. ISSN: 0032-1052.
FARKAS, L. G.; KOLAR, J. C. Anthropometrics and art in the aesthetics of women's faces. Clinics in Plastic Surgery, vol. 14, no. 4, pp. 599-616, Oct. 1987. ISSN: 0094-1298.
FARKAS, L. G. Examination. In: Anthropometry of the Head and Face, 2nd ed. New York: Raven Press, 1994. pp. 3-56.
FARROW, A. L.; ZARRINIA, K.; AZIZI, K. Bimaxillary protrusion in black americans – an esthetics evaluation and the treatment considerations. American Journal of Orthodontics and Dentofacial Orthopedics, vol. 104, no. 3, pp. 240-250, Sep. 1993. ISSN: 0889-5406.
FERRARIO, V. F. et al. Soft tissue facial growth and development as assessed by the three dimensional computerized mesh diagram analysis. American Journal of Orthodontics and Dentofacial Orthopedics, vol. 116, no. 2, pp. 215-228, Aug. 1999. ISSN: 0889-5406.
FISCHER, R. Aesthetics and the biology of the fleeting moment. Perspectives in Biology and Medicine, vol. 8, no. 1, pp. 210-216, 1965. ISSN: 0031-5982.
FITZGERALD, J. P.; NANDA, R. S.; CURRIER, G. F. Evaluation of nasolabial angle. American Journal of Orthodontics and Dentofacial Orthopedics, vol. 102, no. 4, pp. 328-334, Oct. 1992. ISSN: 0889-5406.
FORD, C. S.; PROTHRO, E. T.; CHILD, I. L. Some transcultural comparisons of esthetic judgement. The Journal of Social Psychology, vol. 68, no. 1, pp. 19-24, Jan. 1966. ISSN: 0022-4545.
FOSTER, E. J. Profile preferences among diversified groups. The Angle Orthodontist, vol. 43, no. 1, pp. 34-40, Jan. 1973. ISSN: 0003-3219.
GOLDWYN, R. M. The face and the psyche, a greek concept. Plastic and Reconstructive Surgery, vol. 38, no. 3, pp. 270-271, Sep. 1966. ISSN: 0032-1052.
GONZALEZ-ULLOA, M. Quantitative principles in cosmetic surgery of the face (profileplasty). Plastic and Reconstructive Surgery, vol. 29, no. 1, pp. 186-190, Jan. 1962. ISSN: 0032-1052.
HALL, D. et al. The perception of optimal profile in African Americans versus white Americans as assessed by orthodontists and the lay public. American Journal of Orthodontics and Dentofacial Orthopedics, vol. 118, no. 5, pp. 514-525, Nov. 2000. ISSN: 0889-5406.
HANCOCK, D. R.; FLOWERS, C. P. Comparing social desirability responding on World Wide Web and paper-administered surveys. Educational Technology, Research and Development, vol. 49, no. 1, pp. 5-13, Jan. 2001. ISSN: 1042-1629.
HELLMAN, M. Some facial features and their orthodontic implications. American Journal of Orthodontics and Oral Surgery, vol. 25, no. 1, pp. 927-951, Jan. 1939.
HERSHON, L. E.; GIDDON, D. B. Determinants of facial profile self-perception. American Journal of Orthodontics, vol. 78, no. 3, pp. 279-295, Sep. 1980. ISSN: 0002-9416.
HIER, L. A. et al. Comparison of preferences in lip position using computer animated imaging. The Angle Orthodontist, vol. 69, no. 3, pp. 231-238, June 1999. ISSN: 0003-3219.
HOLDAWAY, R. A. A soft tissue cephalometric analysis and its use in orthodontic treatment planning, part I. American Journal of Orthodontics and Dentofacial Orthopedics, vol. 84, no. 1, pp. 1-28, July 1983. ISSN: 0889-5406.
HORSWILL, M. S.; COSTER, M. E. User-controlled photographic animations, photograph-based questions, and questionnaires: three Internet-based instruments for measuring drivers' risk-taking behavior. Behavior Research Methods, Instruments, & Computers, vol. 33, no. 1, pp. 46-58, Feb. 2001. ISSN: 0743-3808.
HOSS, K. et al. The accuracy of video imaging for mixed dentition and adolescent treatment. The Angle Orthodontist, vol. 67, no. 5, pp. 355-364, May 1997. ISSN: 0003-3219.
HOUSTON, J. D.; FIORE, D. C. On-line medical surveys: using the Internet as a research tool. M.D. Computing: Computers in Medical Practice, vol. 15, no. 2, pp. 116-120, Mar. 1998. ISSN: 0724-6811.
HSIEH, Y. Y. et al. The prenatal diagnosis of Pierre-Robin sequence. Prenatal Diagnosis, vol. 19, no. 6, pp. 567-569, June 1999. ISSN: 0197-3851.
HSU, B. S. Comparisons of the five analytic reference lines of the horizontal lip position: their consistency and sensitivity. American Journal of Orthodontics and Dentofacial Orthopedics, vol. 104, no. 4, pp. 355-360, Oct. 1993. ISSN: 0889-5406.
HWANG, H. S.; KIM, W. S.; McNAMARA Jr, J. A. A comparative study of two methods of quantifying the soft tissue profile. The Angle Orthodontist, vol. 70, no. 3, pp. 200-207, June 2000. ISSN: 0003-3219.
ILIFFE, A. H. A study of preferences in feminine beauty. The British Journal of Psychology, vol. 51, no. 1, pp. 267-273, Feb. 1960. ISSN: 0007-1269.
KINGSLEY, N. A. Treatise on oral deformities as a branch of mechanical surgery. Appleton, New York, 1880, pp. 465-509. apud LEWIS, W. N. Reviews and cephalometrics. The Angle Orthodontist, vol. 61, no. 2, pp. 153-154, Feb. 1991. ISSN: 0003-3219.
KITAY, D. et al. Computer animated comparison of self-perception with actual profiles of orthodontic and nonorthodontic subjects. International Journal of Adult Orthodontics and Orthognathic Surgery, vol. 14, no. 2, pp. 125-134, Feb. 1999. ISSN: 0742-1931.
KOCH, N. S.; EMREY, J. A. The Internet and opinion measurement: surveying marginalized populations. Social Science Quarterly, vol. 82, no. 1, pp. 131-138, Mar. 2001. ISSN: 0038-4941.
LAVATER, J. C. Essays on physiognomy. Vols. I, II, III. London: G.G. and J. Robinson, 1789.
LEGAN, H. L.; BURSTONE, C. J. Soft tissue cephalometric analysis for orthognathic surgery. Journal of Oral Surgery, vol. 38, no. 10, pp. 744-751, Oct. 1980. ISSN: 0022-3255.
LISCHER, B. E. Principles and methods of orthodontics. Philadelphia, Lea and Febiger, 1912. pp. 118-126.
LUNDSTRÖM, A. et al. A proportional analysis of the soft tissue facial profile in young adults with normal occlusion. The Angle Orthodontist, vol. 62, no. 2, pp. 127-134, Summer 1992. ISSN: 0003-3219.
MAGANZINI, A. L.; TSENG, J. Y. K.; EPSTEIN, J. Z. Perception of facial esthetics by native chinese participants by using manipulated digital imagery techniques. The Angle Orthodontist, vol. 70, no. 5, pp. 393-399, Oct. 2000. ISSN: 0003-3219.
MARTIN, J. G. Racial ethnocentrism and judgement of beauty. The Journal of Social Psychology, vol. 63, no. 1, pp. 59-65, Jan. 1964. ISSN: 0022-4545.
McCULLOUGH, D. Web-based market research, the dawning of a new era. Direct Marketing, vol. 61, no. 8, pp. 36-39, Aug. 1998. ISSN: 1094-9968.
McNAMARA Jr, J. A.; BRUST, E. W.; RIOLO, M. Soft tissue evaluation of individuals with an ideal occlusion and a well-balanced face. In: McNamara Jr, (ed) Esthetics and the Treatment of Facial Form. Craniofacial Growth Series 28. Ann Arbor: Center for Human Growth and Development, The University of Michigan, pp. 115-146, 1993.
MEJIA-MAIDL, M.; EVANS, C. A. Soft tissue facial considerations and orthodontic treatment. Seminars in Orthodontics, vol. 6, no. 1, pp. 3-20, Mar. 2000. ISSN: 1073-8746.
MERRIFIELD, L. L. The profile line as an aid in critically evaluating facial esthetics. American Journal of Orthodontics, vol. 52, no. 11, pp. 804-822, Nov. 1966. ISSN: 0002-9416.
MOORE, A. W. A critique of orthodontic dogma. The Angle Orthodontist, vol. 39, no. 2, pp. 69-82, Apr. 1969. ISSN: 0003-3219.
MOORREES, C. F. A.; KEAN, M. R. Natural head position, a basic consideration in the interpretation of cephalometric radiographs. American Journal of Physical Anthropology, vol. 16, no. 1, pp. 213-234, Jan. 1958. ISSN: 0002-9483.
NANDA, R. S. et al. Growth changes in the soft tissue facial profile. The Angle Orthodontist, vol. 60, no. 3, pp. 177-190, Fall 1990. ISSN: 0003-3219.
NANDA, R. S.; GHOSH, J.; BAZAKIDOU, E. Three-dimensional facial analysis using a video imaging system. The Angle Orthodontist, vol. 66, no. 3, pp. 181-188, Mar. 1996. ISSN: 0003-3219.
NANDA, R. S.; GHOSH, J. (1980). apud SADOWSKI, P. L., (ed). Atualidades em Ortodontia [in Portuguese]. Premier, São Paulo, 1997. p. 66.
NOMURA, M. et al. A study of the harmonious profile in facial esthetics. Part I. Descriptive statistics. The Bulletin of Tokyo Dental College, vol. 40, no. 1, pp. 35-46, Feb. 1999. ISSN: 0040-8891.
OKUYAMA, C. C.; MARTINS, D. R. Preferência do perfil facial tegumentar, em jovens leucodermas, melanodermas e xantodermas de ambos os sexos, avaliados por ortodontistas, leigos e artistas plásticos [in Portuguese; "Preference for the integumental facial profile in young leucoderm, melanoderm, and xanthoderm subjects of both sexes, evaluated by orthodontists, laypeople, and plastic artists"]. Ortodontia, vol. 30, no. 1, pp. 6-18, Jan. 1997. ISSN: 0030-5944.
PAPASOTIRIOU, O. S.; NATHANSON, D.; GOLDSTEIN, R. E. Computer imaging versus conventional esthetic consultation: a prospective clinical study. Journal of Esthetic Dentistry, vol. 12, no. 2, pp. 72-77, Feb. 2000. ISSN: 1040-1466.
PARK, Y. C.; BURSTONE, C. J. Soft-tissue profile – fallacies of hard-tissue standards in treatment planning. American Journal of Orthodontics and Dentofacial Orthopedics, vol. 90, no. 1, pp. 52-62, July 1986. ISSN: 0889-5406.
PECK, H.; PECK, S. A concept of facial esthetics. The Angle Orthodontist, vol. 40, no. 4, pp. 284-318, Oct. 1970. ISSN: 0003-3219.
PECK, S.; PECK, L. In: SADOWSKI, P. L., (ed). Atualidades em Ortodontia [in Portuguese]. Premier, São Paulo, 1997. p. 63.
PERRETT, D. I.; MAY, K. A.; YOSHIKAWA, S. Facial shape and judgements of female attractiveness. Nature, vol. 17, no. 368, pp. 239-242, Mar. 1994. ISSN: 0028-0836.
PRAHL-ANDERSON, B. et al. Perceptions of dentofacial morphology by laypersons, general dentists and orthodontists. The Journal of the American Dental Association, vol. 98, no. 2, pp. 209-212, Feb. 1979. ISSN: 0002-8177.
PROFFIT, W. R. Treatment planning: the search for wisdom. In: PROFFIT, W. R.; WHITE, R. P. (eds). Surgical Orthodontic Treatment. St. Louis, Mosby, 1991.
RICKETTS, R. M. Esthetics, environment, and the law of lip relation. American Journal of Orthodontics, vol. 54, no. 4, pp. 272-289, Apr. 1968. ISSN: 0002-9416.
RIEDEL, R. A. An analysis of dentofacial relationships. American Journal of Orthodontics, vol. 43, no. 1, p. 103, Oct. 1957. ISSN: 0002-9416.
ROMANI, K. L. et al. Evaluation of horizontal and vertical differences in facial profiles by orthodontists and lay people. The Angle Orthodontist, vol. 63, no. 3, pp. 175-182, Fall 1993. ISSN: 0003-3219.
SARVER, D. M.; ACKERMAN, J. L. Orthodontics about face: the re-emergence of the esthetic paradigm. American Journal of Orthodontics and Dentofacial Orthopedics, vol. 117, no. 5, pp. 575-576, May 2000. ISSN: 0889-5406.
SCHAEFFER, D. R.; DILLMAN, D. A. Development of a standard e-mail methodology: results of an experiment. York, 1998. ISSN: 1094-0068.
SCHILLEWAERT, N.; LANGERAK, F.; DUHAMEL, T. Non probability sampling for WWW surveys: a comparison of methods. Journal of the Market Research Society, vol. 4, no. 40, pp. 307-313, Fall 1998.
SCHWARTZ, N.; STRACK, F.; MAI, H. Assimilation and contrast effects in part-whole question sequences: a conversational logic analysis. Public Opinion Quarterly, vol. 55, no. 1, pp. 3-23, 1991. ISSN: 0033-362X.
SCHWARTZ, N. What respondents learn from questionnaires: the survey interview and the logic of conversation. International Statistical Review, vol. 63, no. 2, pp. 153-168, Apr. 1995. ISSN: 0306-7734.
SCOTT, S. H.; JOHNSTON Jr, L. E. The perceived impact of extraction and nonextraction treatments on matched samples of African American patients. American Journal of Orthodontics and Dentofacial Orthopedics, vol. 116, no. 3, pp. 352-360, Sep. 1999. ISSN: 0889-5406.
SHEEHAN, K. B.; HOY, M. G. Using e-mail to survey Internet users in the United States: methodology and assessment. Journal of Computer Mediated Communication, vol. 4, no. 3, pp. 110-134, Mar. 1999. ISSN: 1083-6101.
SKINAZI, G. L.; LINDAUER, S. J.; ISAACSON, R. J. Soft tissue profile in young adults. American Journal of Orthodontics and Dentofacial Orthopedics, vol. 106, no. 5, pp. 518-523, Nov. 1994. ISSN: 0889-5406.
SOLOW, B.; TALGREN, A. Natural head position in standing subjects. Acta Odontologica Scandinavica, vol. 29, no. 5, pp. 591-607, Nov. 1971. ISSN: 0001-6357.
SPYROPOULOS, M. N.; HALAZONETIS, D. J. Significance of the soft tissue profile on facial esthetics. American Journal of Orthodontics and Dentofacial Orthopedics, vol. 119, no. 5, pp. 464-471, May 2001. ISSN: 0889-5406.
STEINER, C. C. The use of cephalometrics as an aid to planning and assessing orthodontic treatment. American Journal of Orthodontics, vol. 46, no. 1, pp. 721-735, Jan. 1960. ISSN: 0002-9416.
STEINER, C. C. Cephalometrics for you and me. American Journal of Orthodontics, vol. 39, no. 1, pp. 729-755, Feb. 1953. ISSN: 0002-9416.
SUBTELNY, J. D.; ROCHESTER, N. Y. A longitudinal study of soft tissue facial structures and their profile characteristics, defined in relation to underlying skeletal structures. American Journal of Orthodontics, St. Louis, vol. 45, no. 7, pp. 481-507, July 1959. ISSN: 0002-9416.
SUSIN, C.; RÖSING, C. K. Praticando odontologia baseada em evidências [in Portuguese; "Practicing evidence-based dentistry"]. Canoas: ULBRA, 1999. 176 pp. ISBN 85-85692-62-6.
TERHANIAN, G. Lessons from the Harris poll on-line. Paper presented at the Annual Meeting of the American Association for Public Opinion Research, St. Petersburg Beach, FL, 1999.
UDRY, J. R. Structural correlates of feminine beauty preferences in Britain and the United States: a comparison. Sociology and Social Research, vol. 49, no. 1, pp. 330-339, Oct. 1965. ISSN: 0038-0393.
VALENTIN, D.; ABDI, H.; EDELMAN, B. From rotation to disfiguration: testing a dual-strategy model for recognition of faces across view angles. Perception, vol. 28, no. 7, pp. 817-824, Sep. 1999. ISSN: 0301-0066.
VON KOENIGSWALD, G. H. R. The evolution of man. Ann Arbor, University of Michigan Press, 1962. p. 141.
WALKER, A. Beauty: illustrated chiefly by an analysis and classification of beauty in women. New York, Langley, 1840. pp. 238-243, 290-291, 313.
WARE, C. Information visualization: perception for design. San Francisco: Morgan Kaufman, 1999.
WILSON, W. L. A critical analysis of orthodontic concepts and objectives. American Journal of Orthodontics, vol. 43, no. 1, pp. 891-918, Sep. 1957. ISSN: 0002-9416.
WOOLNOTH, T. The study of the human face. London, W. Tweedie, 1865. pp. 181-244.
YAMANAKA, H. et al. A questionnaire-based survey on the Internet concerning optimal timing for knee surgery in a patient with rheumatoid arthritis. Ryumachi, vol. 41, no. 1, pp. 25-30, Feb. 2001. ISSN: 0033-9157.
YEAWORTH, R. C. Use of the Internet in survey research. Journal of Professional Nursing, vol. 17, no. 4, pp. 187-193, July 2001. ISSN: 8755-7223.
ZIKMUND, W. G. Exploring Marketing Research, 4th Edition. Chicago: Dryden Press, 1991.
ANNEXES
ANNEX A – Approval by the Scientific Committee and Ethics Committee

ANNEX B – Informed Consent for Use of the Images
Informed Consent Form
Name: _______________________________________________.
I authorize the researcher Rodrigo Martins Boos, a Master's candidate in Orthodontics and Dentofacial Orthopedics at PUCRS, to use the photographic and digital images of my face, viewed in profile, in research on characteristics of esthetic preference regarding the face viewed in profile. I have been informed of the methodology involved in such research, in which these images, and others originating from digital manipulations, will be disclosed in the media proposed in the aforementioned methodology(ies). I am aware that these images will form part of a scientific archive to be kept under the researcher's custody.
- The procedure begins with obtaining a head-and-shoulders photograph, in profile view.
- Digital alterations to various anatomical structures of this initial image will be performed, producing eleven other digital images.
- Cephalometric measurements performed on various structures visible in these images will be analyzed, tabulated, disclosed, presented, and archived.
- The purpose will be to present the images for evaluation of the population's preference regarding the facial characteristics shown in these photographs, through specific means, such as the Internet, for example, and eventually through contact with an interviewer, via intercept and computer-assisted interview.
- The image obtained, the images resulting from the aforementioned digital manipulations, and the data and results obtained will form part of an archive for subsequent research and publications in the fields involved.
- Additionally, I am aware that I may, at any time and at no cost, request the discontinuation of the use of these images for new research, in which case only the use of the images already obtained for the accreditation of research already carried out will remain authorized.
The patient signed below and their guardian/legal representative declare that:
a) they have read the entire content of this informed consent form; b) they have understood and agree with what will be done; c) the purpose and use of these images has been explained, as well as the possibility of discontinuing their use in subsequent research; d) they consequently authorize and give consent:
Patient: _______________________________ Guardian/legal representative: _______________________________
Informed consent is an indispensable condition of the professional–patient relationship and of research with human subjects. It is a voluntary decision, made by an autonomous and competent person, taken after an informative and deliberative process, aimed at accepting a specific treatment or experimental procedure, with knowledge of its nature, its consequences, and its risks.
Clotet, J. Informed consent in Research Ethics Committees and in medical practice: concept, origins, and current status. Revista Bioética. Federal Council of Medicine, vol. 3, no. 2, p. 17, 1995.
Saunders, C. M.; Baum, M.; Houghton, J. Consent, research and the doctor-patient relationship. In Gillon R, editor. Principles of Health Care Ethics. London, John Wiley & Sons, 1994: 457-70.
APPENDIX 1 – Additional Information on CD-ROM
[The original dissertation included a CD-ROM appendix with the full electronic questionnaire, raw vote data, and supplementary statistical output. This material is not reproduced in the present text version.]